Portfolio Controls
Creating individual systems is done via the research facility, but combining them is done here.

Systems Charts
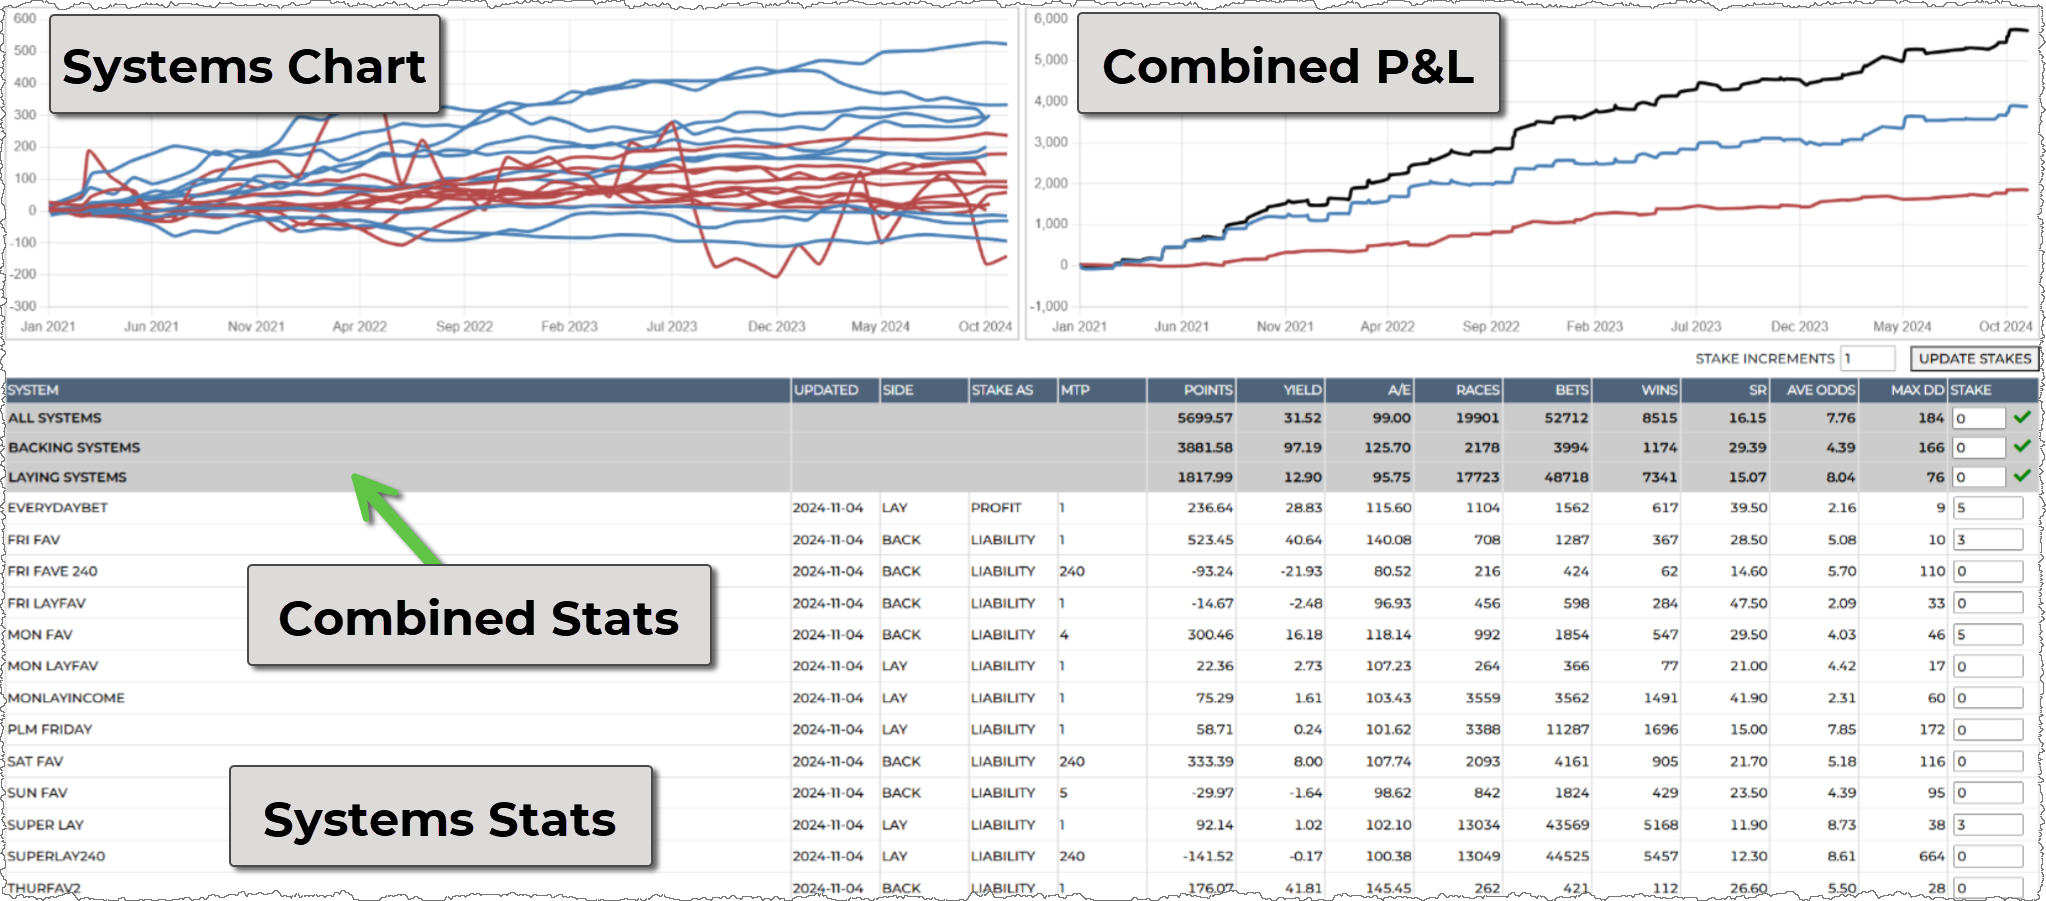
The systems chart show all your individual systems, backing in blue and laying in red. Hovering over the line in the systems chart highlights the system in the chart and table for easy viewing.
The combine charts shows: back, lay and all systems combined.
Systems Table
The table lists your systems and has 3 top rows that summarise the stats for: all, backing and laying systems combined. The points column here takes into account the stake you've used for your systems.
Hovering over a system in the table highlights it in the chart.
Setting all systems stake at once (or just all backing, or all laying systems) can be done by entering an amount the the relevant summary stake input and clicking the 'tick box'.
Tips
Try and reduce your drawdown and increase your consistency of profits with this tool. Profit is one thing, but consistency is essential for long term success.