Leverage the Research Tool to create and manage your systems and shortlists efficiently, enabling you to make informed betting decisions.
Introduction
Unlock Winning Strategies with the Shortlist Feature
Hedger Pro boasts a powerful Shortlist Feature designed to help you filter daily runners based on performance stats, race characteristics, runner characteristics, and price information.
Whether you want to create multiple shortlists for streamlined viewing or identify runners in race cards that align with your shortlist angles, we've got you covered.
Shortlists are generated using our innovative Research Tool, which visually displays the profitability of various race and runner statistics. This graphical representation offers a quick and efficient pathway to developing your new betting systems.
Your saved systems are easily accessible as shortlists of runners directly in the race cards.
Data-Driven Insights at Your Fingertips
Our unique research system utilizes intuitive charts to illustrate the profitability of race and runner elements. These visual tools include bar charts, line charts and tables, allowing for a comprehensive analysis of your selections.
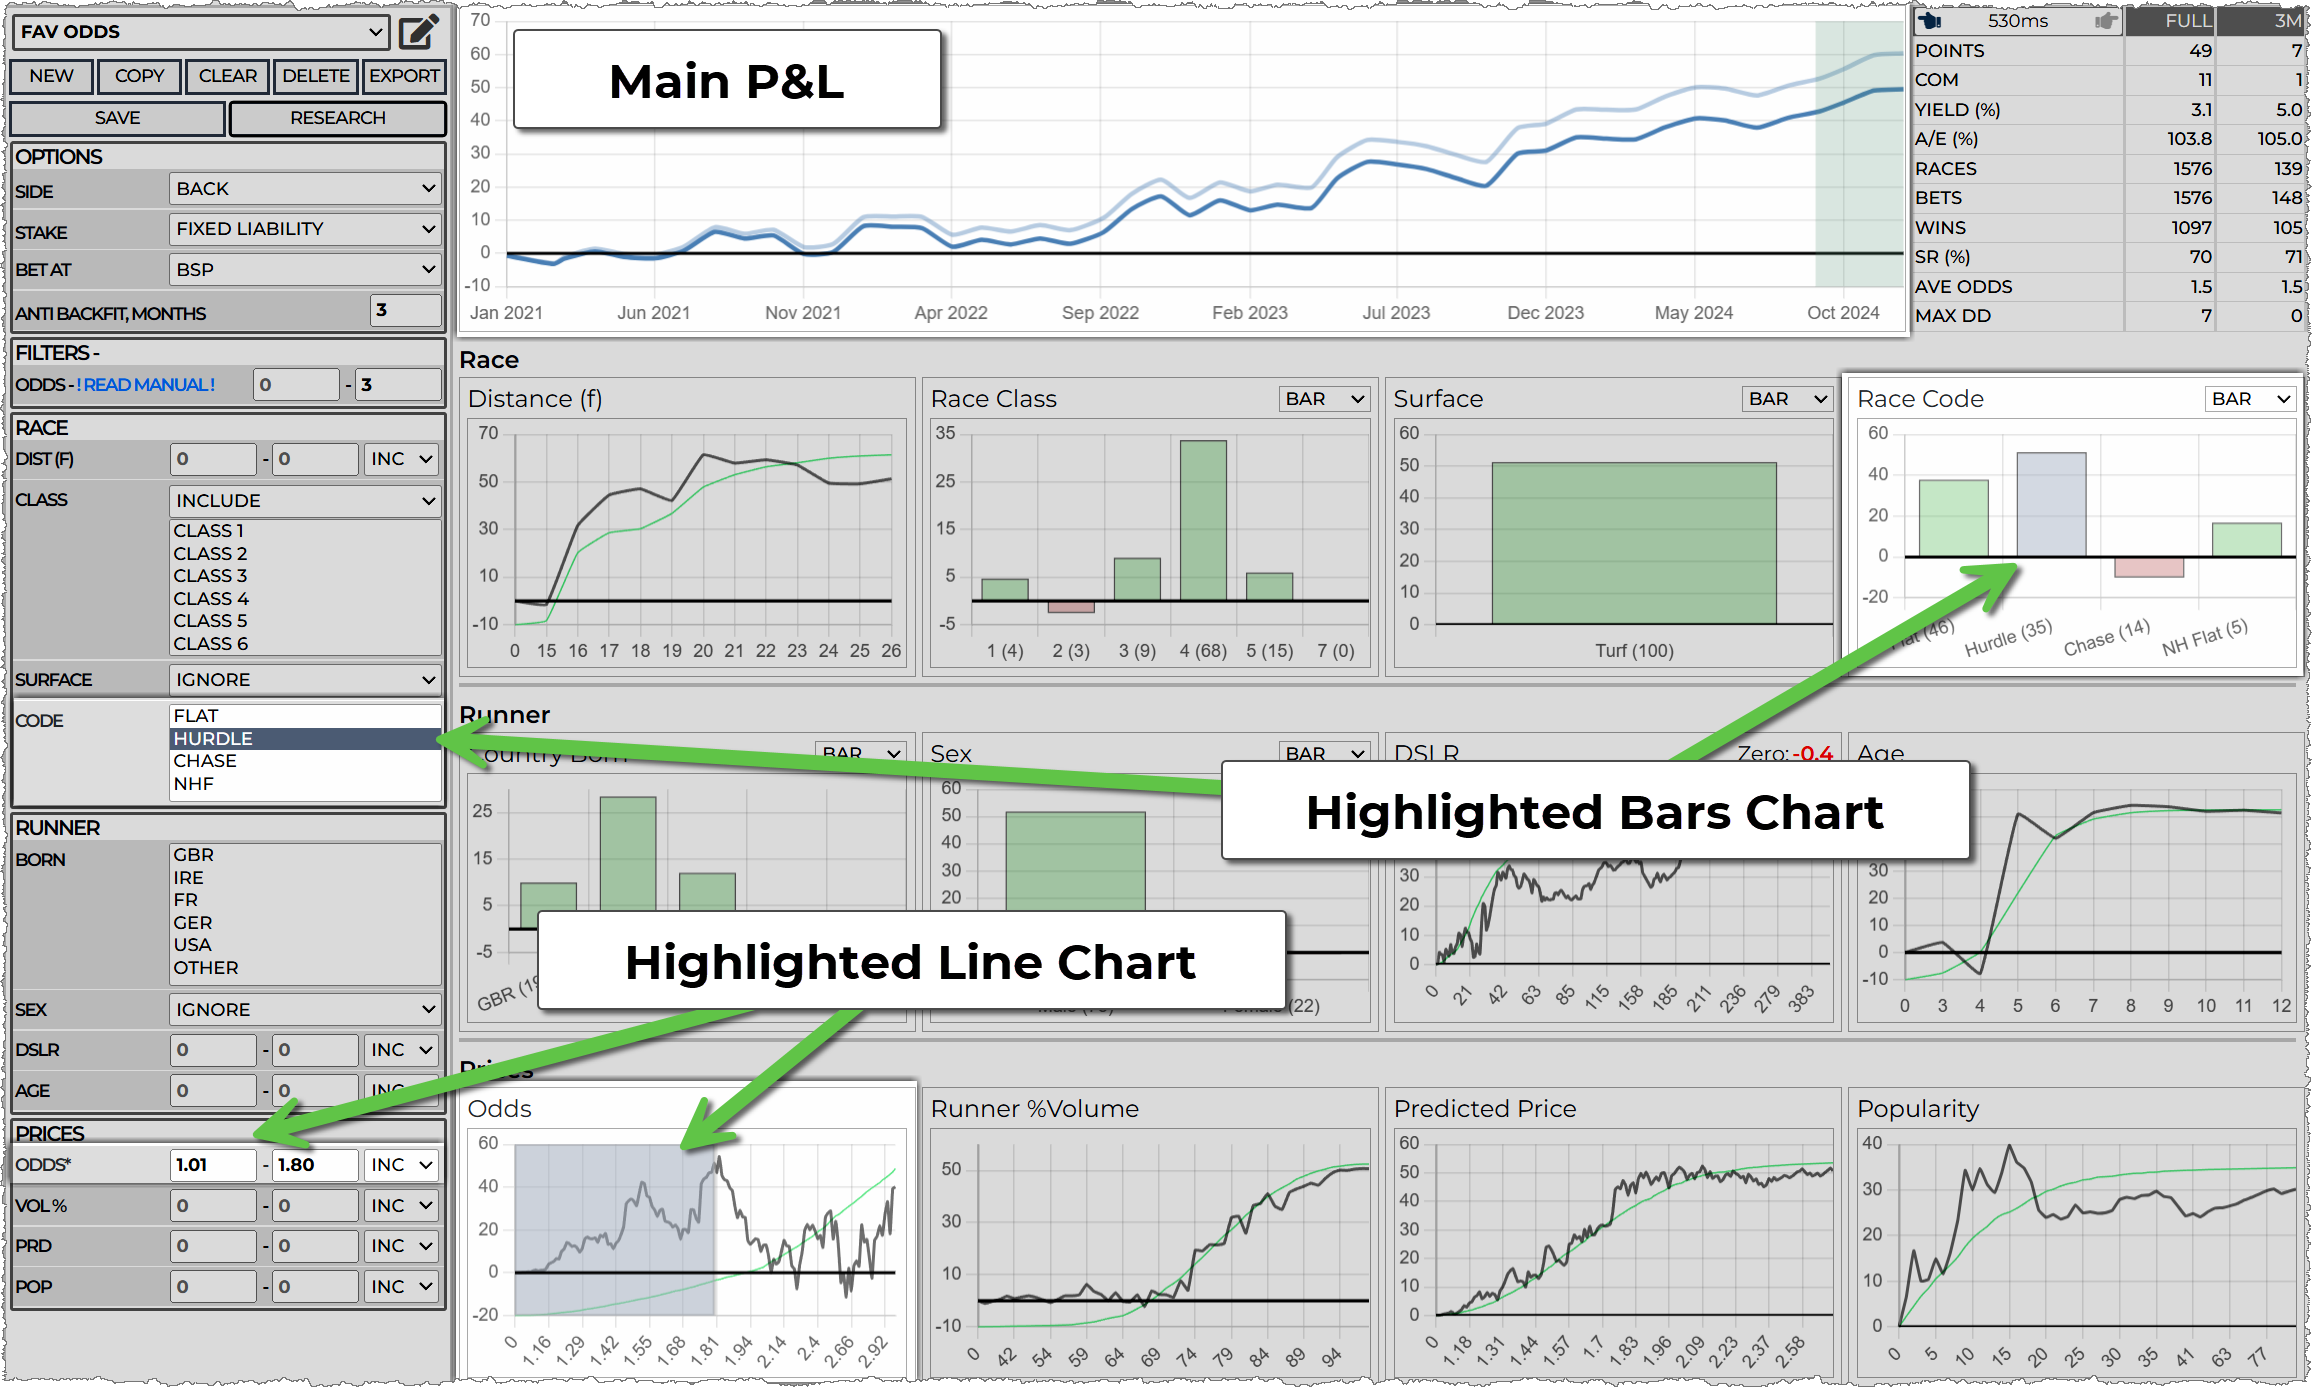
Just as a company's profit trends over time, our graphs reveal odds versus profits, the area of interest is where the data trends upwards. In this example, between 0 and 1.8: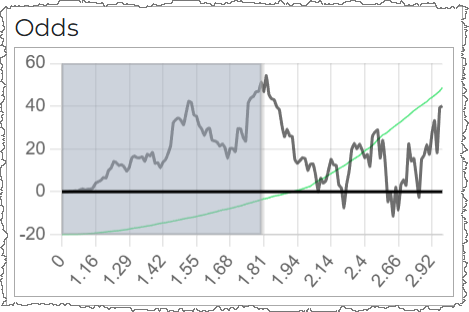
Important points to remember about the chart data
Commission-Free Profits
Profits, in the category charts, are displayed without commission, as applying commission universally is impractical.
Recent Data Limitation
Profits, in the category charts, are shown for up to 6 months ago to help prevent the back-fitting of systems. (Note: You can adjust this time frame using the filter options, with 6 months as the default.)
The main Profit and Loss (P&L) chart is kept current and includes commission, which we'll cover in more detail later.
Visualizing Profitability
Bar Charts
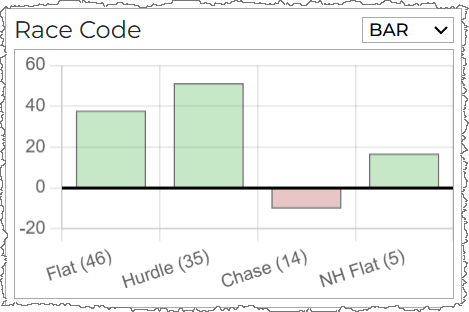
Bar charts show profit, in points, per category.
The Race Code chart here shows hurdle races with most points. You can switch to table view form bar chats for more details.
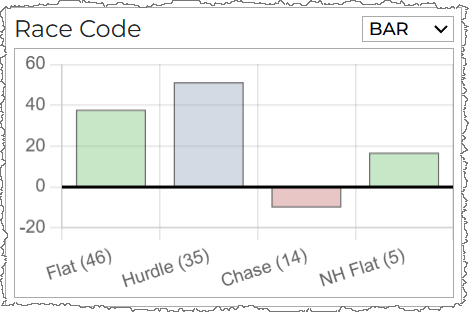
Click the bar to select / deselect the category
Tables
Tables present data in columns, providing additional insights such as Yield (ROI), Runs, and the number of Bets (runners) in each category. Here, Hurdle may have the most points, while NHF could yield the best ROI.
Click the 'INC' checkbox to select / deselect the category
Line Charts
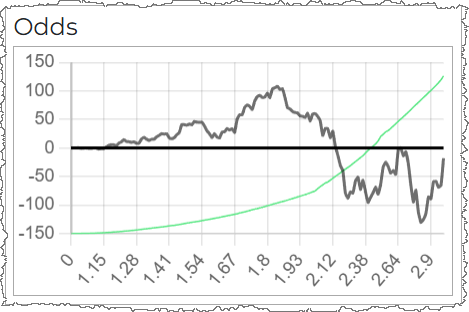
Line charts are utilized when numerous categories are involved (e.g., odds), they highlight upward trends in the data. For instance, this Odds Chart indicates a profitable range from approximately 0 to 1.8.
The Odds chart shows a profits region from around 0 to 1.8.

Interacting
It is simple to interact with the charts, simply click to select / deselect categories or drag areas to refine your analysis.
The settings panel filters align with your selected areas and categories in the charts and tables, with main P&L stats displayed prominently at the top.
Embrace the Learning Curve
This advanced data analysis method may seem overwhelming initially, but with practice, you'll quickly realize how efficiently you can build portfolios of successful systems.
Getting Started
To access the Systems Research Tool, click RESEARCH on the main navigation tab.

You can now start creating systems. The 'Systems List Editor' opens all the filter opens to choose the ones you want to activate
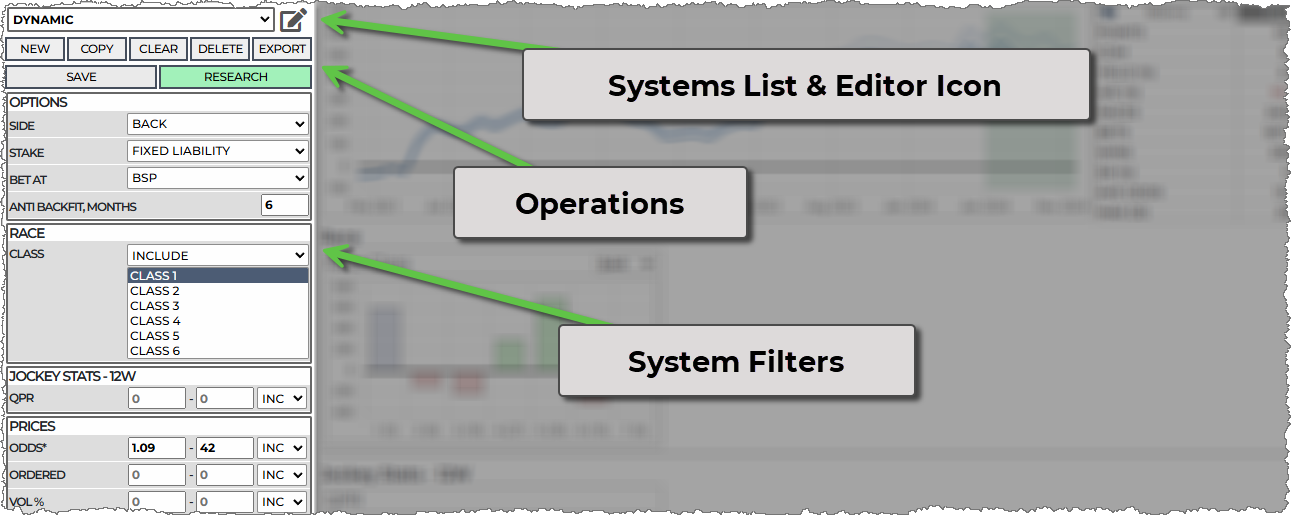
Key Operations for System Management
You can easily create, copy, clear, delete, and export systems. The two primary operations are Save and Research.
System Filters
Filters allow you to sift through races and runners for profitability. Available filter types include:
Ranges
Set minimum and maximum values.
Multi-Select
Choose one or more values (e.g., Class 3 and 4 or 1 and 6).
Single Select (Dropdown)
Select a single value (e.g., surface: AW).
Operations
These operation are for managing your systems
NEW
To create a new system, simply name it and click ADD. You can also import one or multiple systems by pasting text from a system export.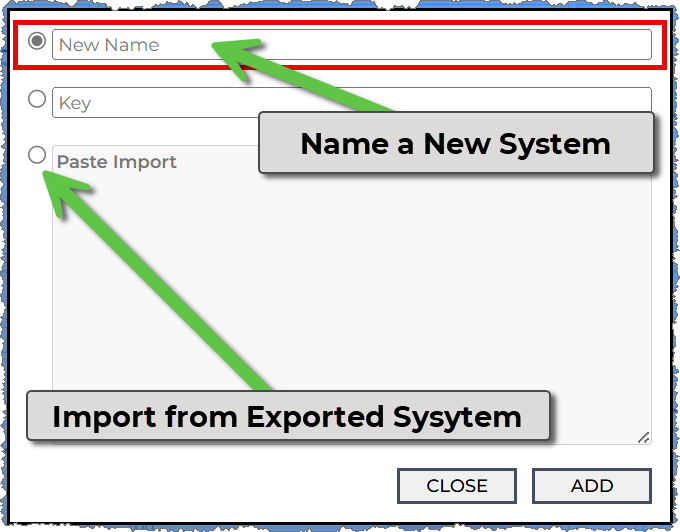
COPY
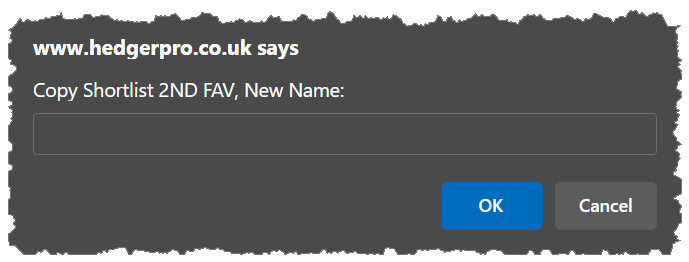
Easily copy existing systems (e.g., copying a system called '2ND Fav') to streamline your workflow and avoid re-entering filters.
CLEAR
Reset to default settings (confirmation box will appear).
DELETE
Permanently remove a system (confirmation required to prevent accidental deletions).
EXPORT
Export a list of qualifiers to Excel or third-party automation betting solutions.
SAVE
Save your system whenever you're satisfied with the settings. This action solidifies your system and generates a new shortlist of runners, so be sure to do this to avoid losing your work.
RESEARCH
This feature shows you the charts and tables of profitability based on your chosen filters. If many filters are open, expect longer response times. The results will provide a wealth of data to explore.
Filters Editor
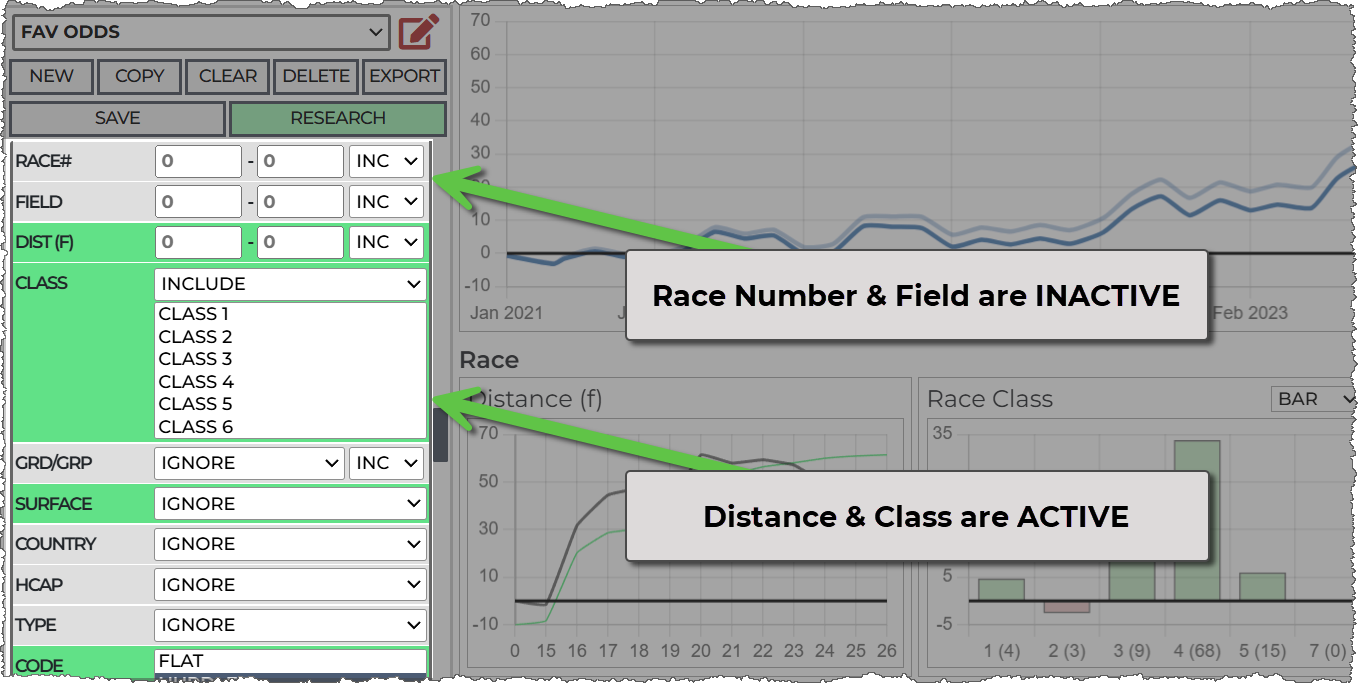
To choose your desired filters, click the Filters Editor icon (red when open). When you click a filter name, it turns green; entering any values will automatically change its colour. After clicking RESEARCH, only the selected filters will remain visible.

Click the filter name and it will turn green, if you enter any values it will become green automatically. When you click 'RESEARCH' the filters will collapse back to show you only the ones you have an interest in.
The more filters you add the longer your research results will take.
Saving Your System
Always save your system when satisfied with the settings. After saving, the shortlisted and exported runners will reflect your new parameters—this won't happen unless you save.
Using Filters
These settings filters runners that match the ranges and categories you choose, there are three types of filter:
Ranges
Filters like odds, where the values flow numerically, we set minimum and maximum values, a value of zero indicates the filter is not set.![]()
Ranges typically are associated with line charts, like this with our selection of 0 to 1.84 highlighted on the chart:
The profit in a line chart 'flows'.
In this example, the distance filter shows races at 10 furlongs makes 20 points. This is because it 'flows' from -18 to 2 on our chart. Setting a min of 10 in the settings highlights from 9 on the chart so it covers the up-trending line, so is in fact anything over 9.

The default is to INCLUDE the range you have set, the alternative is to EXCLUDE. Setting exclude here would result in runners with a distance OUTSIDE of 10 to 15, which would be races 0 to 9 and 16 upwards.
Setting filters 0 to 0 makes them inactive, so, if you want to actively set a filter to search for 0, you'll need to use the 'exclude' option and select 1 to 1000 to effectively 'include' 0-0.
There are not many filters where you can do this. A DSLR of 0-0, for example, would select horse with no previous runs, but distance and many other filters would be invalid as there are no zero's in the data.
Selects
A filter like surface where there can really only be one option, we choose a single value from a select dropdown.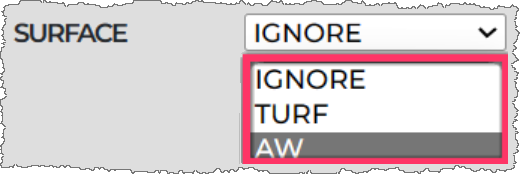
Whereas a filter like Race Code allows multiple selections
Distinct characteristics like this are shown as bar chart, here Race Code, with profitable metrics in green and unprofitable in red.
You may click on a bar to toggle in on / off, this will automatically update the system settings in the setting panel.
Bar charts type filter also allow for a tabular view that you can choose with the dropdown on each filter separately. Here is a table for Race Code, ordered by number of bets: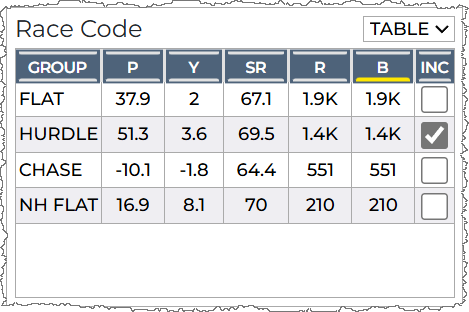
The columns are:
P: Points
Y: Yield
SR: Strike Rate
R: Races
B: Bets
Inc: Toggle to include as a filter
This graphical nature may seem like overkill at first. However, it won't take long before you realise how much more efficient and easy it is to build comprehensive systems up when you can see data presented in this way.
Filters List
NOTES
This section allows you to add notes to your systems for better organization.
OPTIONS
The main system building options are:
Side: Choose the bet type (Back or Lay).
Stake: Determine whether you want Fixed Liability or Fixed Profit calculations.
Backing: Fixed Liability is a normal back bet, while Fixed Profit aims for a profit of 1 point per bet, adjusting stakes based on odds.
Laying: Fixed Profit follows a similar approach as backing, while Fixed Liability targets a profit of 1 point per bet.
Bet At: Choose BSP and MTP.
Bet at BSP: Profits for filter charts and main P&L are calculated at the Betfair Starting Price. Price filters set are assessed against data at the chosen MTP.
Bet at MTP: Profits are calculated using odds recorded at the set minutes to post. If fewer than 200,000 bets are returned in the search, a bar chart of profits against each MTP will be displayed.
Anti Back Fit
All profit charts for filters use data up to, for instance, three months ago. This means you've researched your system with updated data, allowing you to evaluate recent profits in the main chart. This feature is vital for avoiding overfitting parameters.
CARD FILTERS
Understanding how cards filters work is important for building your systems and viewing the qualifiers in the cards.
THESE SETTING HAVE NO AFFECT ON RESEARECH RESULTS - THEY ARE FOR CARDS FILTERING ONLY
Odds
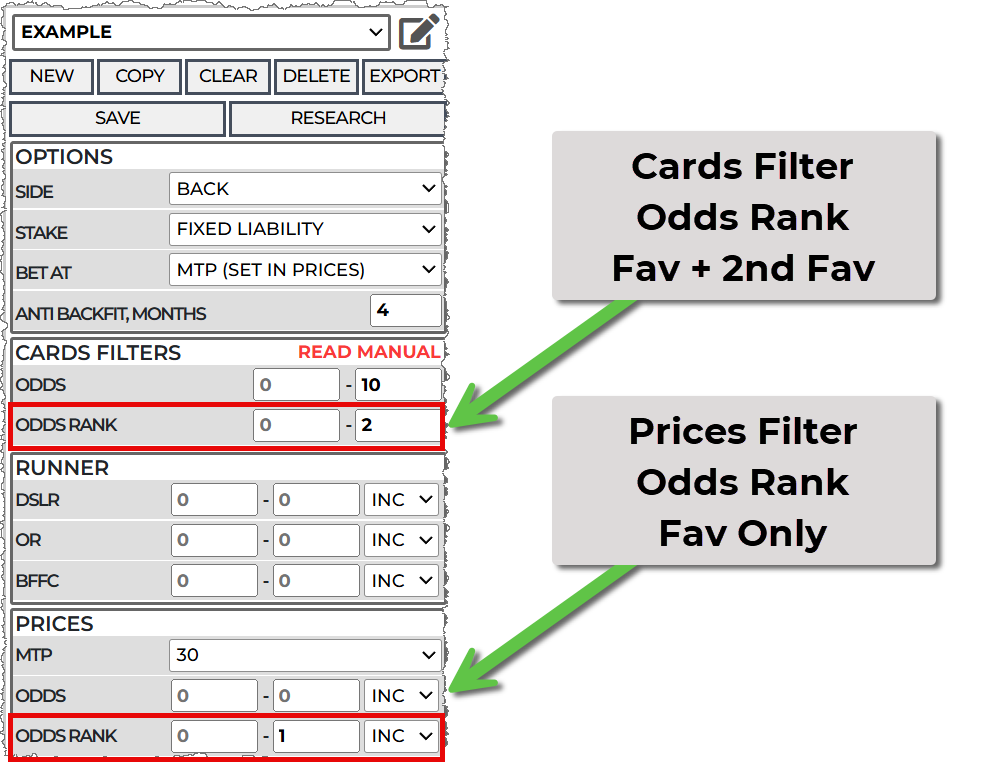
There are TWO odds ranges you can set. The first is in CARDS FILTERS, the second is in PRICES section:
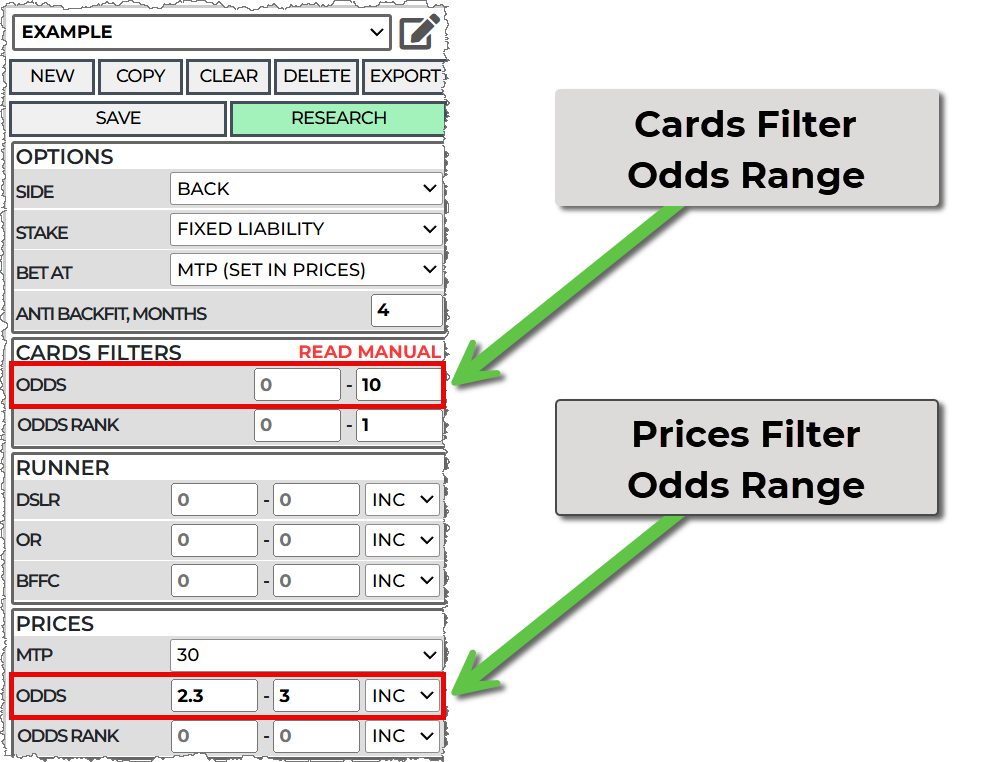
Setting an odds range in the CARDS FILTERS zooms in the odds chart while adjusting in the PRICES section filters the horses for research purposes. The research system will not filter odds outside the CARDS FILTER odds range - for example; if you set 0-10 in CARDS FILTERS and 0 - 20 in the PRICES then it will filter 0 - 10.
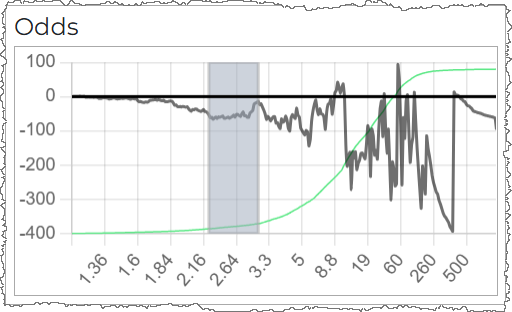
In these two examples I'll set the PRICES section odds range from 2.2 to 3.
This is ONLY to serve as an example, its far too specific for an actual useful search.
With the CARDS FILTERS ODDS set: 0 to 1000:
With the CARDS FILTERS Odds set: 0 to 10:
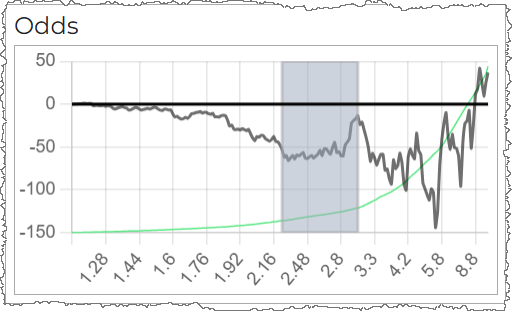
If you know you are always going to be in the bottom end of the market then the second chart is now easier to work with.
There is another benefit when viewing potential qualifiers.
When setting an odds range for your systems (say 2.2 to 3 as above), Hedger Pro does not know in advance which horses will qualify at the 'minutes to post' you want. Therefore it must show you all possible qualifying horses (which is all of them). This is not that helpful when looking at your qualifiers.
The CARD FILTERS odds range filter will help you here. If you set to 0 to 10 (as above), you 'll only be shown horses that are currently 0 - 10 in odds. It's possible that horses currently over 10 will go under 3 but the closer the race gets to your bet time, the less likely that will be. You can set to range tighter if you wish (say 2 to 4) - but that's up to you!
Odds Rank
This is the 'favouritism' of the horse - so the horses in order of odds. This works in the same way as odds.
If you want only the race favourite, then set 0 to 1 in the prices section. In the Cards Filter section, you could set 0 to 1 as well - however there maybe a second favourite that switches place at race time. Setting 0 - 2 will show you both as potential qualifiers
Before the race bet time, the race cards this will show current and potential qualifiers. The potential qualifiers here could switch to become the actual qualifier:

The current qualifier here is likely to still be the favourite at bet time, so you can ignore the potential qualifier:

If you schedule a bet on both to match your system criteria Hedger Pro will only order a bet on the actual qualifying horse.
Tracked Horses
The "Tracked Horse" feature offers a quick-view shortlist, primarily for convenience rather than system building.
If you use the horse tracker function (by clicking the star next to a horse), you can generate a shortlist of these horses by creating a "Systems" shortlist and checking this option. You can also add other filters, like odds range, based on your preferences.
Tracked horses has no bearing on system searches, its for shortlisting horses only.
* The current odds represent the most recent prices recorded at specific MTP intervals: 240, 120, 60, 30, 15, 10, 5, 4, 3, 2, 1, and the final price before the race begins (live races only, recorded at the turn of each minute).
BSP
You may apply BSP filters to systems. Please be aware that Hedger Pro does not know the BSP details of a runner before the race off time, so for practical reasons we suggest you use MTP filters instead. The BSP filters are available for you to use if you require then for comparing to other system research tools or simply for your own analysis.
Odds
Odds Rank
Fav - 1st, 2nd and 3rd Fav.
Fav Odds
RACE
The following race metrics can be filtered by:
Course
Classification
Race Number (of the meeting)
Field (number of runners)
Distance (in Furlongs rounded to the nearest furlong)
Class
Grade or Group number (1, 2 or 3)
Surface Type
Country
Handicapped (Yes or No)
Race Type (Jump or Flat)
Race Code
DATES
Time and date filters include:
AM/PM (Morning or afternoon race)
Hour (of the day)
Day (of the week)
Month (of the year)
RUNNER
The following runner metrics can be filtered by:
Born (in what country)
Sex (male / female)
Gender (sex categorisation)
C Win (has official course win record)
D Win (has official distance win record)
CD Win (has official course / distance win record)
Draw (stall draw)
DSLR (official days since last ran record)
OR (official rating)
Age (current age of horse in years)
BFFC (Betfair Forecast Price)
STATS
Performance data over horse - 12 months, jockey - 12 weeks and trainer - 4 weeks:
RUNS - number of runs in the stats time period
WINS - number of winsin the stats time period
SR (Strike Rate)
ROI (Yield - percentage profit on liability)
A/E (Expected against Actual - how many winners against expected winners)
ADB (Average Distance Beaten)
PRB (Percentage Rivals Beaten) - how many horses the runner beat against the field size.
ABR (Average Book Drop) - The drop in odds during the race. Example: Starting odds = 10, In-play low = 2. Formula: 100/2 - 100/10 = 50 - 10 = 40%
APD (Average Price Reduction) - The difference between starting price and in-play low. Example: Starting odds = 10, In-play low = 2. Formula: 10 - 2 = 8
QPR (Quality Performance Rating) - An AI generated rating that combines stats that are known to have a good affect on in-running performance.
B2L (Back to Lay Stats) - Horse Only
The default is against a DOB (Double of bust) - you may change this is the settings.
RUNS (Can differ from total runs if starting prices were too low)
WINS(Number of successful B2L bets)
ROI (Return on Investment for B2L bets)
SR (Strike rate of winning B2L bets)
LTO
Last Time Out Data
POS: The position the horse recorded last time it ran.
DNF: Odds at the MTP set.
BSP: Odds at the MTP set.
ODDS RANK: The BSP favouritism. (all of them shown as a line chart)
FAV: The BSP favouritism. (1st, 2nd, 3rd shown as a bar chart)
HCAP: The HCAP (Yes, No) of the horses last race.
CLASS DIFF: The change in race class (as long as we have both on record)
DISTANCE DIFF: The change in race distance, rounded to the nearest furlong
RUNNERS DIFF: The change in field size
WGT DIFF: The change in weight carried (as long as we have both on record and are both not zero)
OR DIFF: The change in official rating (as long as we have both on record and are both not zero)
PRICES
Prices and stats are recorded at various MTP intervals: 240, 120, 60, 30, 15, 10, 5, 4, 3, 2, and 1 minute before post.
MTP: The selected 'Minutes To Post' value will be used for all other price filters.
Odds: Odds at the MTP set.
Odds Rank: Favouritism ranking of the horse.
Race Vol K: Total race traded volume (in thousands).
Runner Vol K: Traded volume for the specific runner (in thousands).
Vol %: Percentage of total volume traded on the specific runner.
WAP: Weighed Average Price.
PRD: Predicted price based on volumes and trading patterns.
POP: Popularity score, based on PRD and current price.
HP: Hedge Potential (higher is better).
Fav Odds: Odds of the current favourite, based on selected MTP.
Main P&L Chart & Anti Back Fit Feature
The main P&L chart displays two lines: one with commission (at 2%) and one without. The highlighted green section represents profits after the selected 'anti back-fit' period. Ensure your systems remain profitable during this timeframe; if not, you may have back-fitted the stats.
Filter charts (e.g., class, draw) show data leading up to this time, simulating a scenario where you researched your system 6 months ago and then evaluated subsequent performance. This approach significantly reduces the risk of selecting circumstantial filter sets.

System Stats & Navigation
Stats are shown for the full period and for just the selected 'anti back fit' period. Each has a +/- showing the change from your last search. Key metrics include:

• POINTS: Profit in points from the last search.
• COM: Total commission paid at 2%.
• YIELD: ROI of the system. For lay systems, yield is calculated as profit (in points) divided by full liability, accounted for race by race to incorporate commission.
• A/E: Actual versus Expected - over 100% is desirable, calculated based on total expected wins against actual bets won.
• RACES: Total races where bets were placed.
• BETS: Total number of runners with bets.
• SR: Strike rate as a percentage.
• AVE ODDS: Average odds of bets in the system.
• MAX DD: The largest drawdown experienced; how far below the previous maximum the system dropped before recovery.
Efficient Navigation
Quickly move back and forth over previous searches to review your changes or comparisons. Since systems are stored locally, navigation is rapid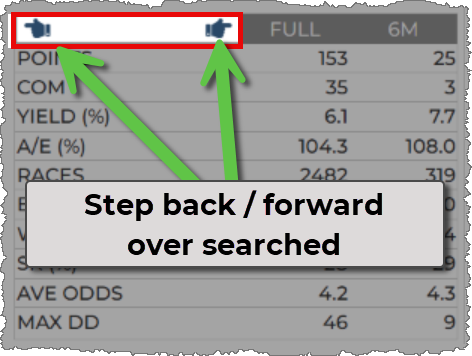 .
.
System Building
When building a system, it's beneficial to start with a premise or concept, such as "low draw + slow ground" or "low-priced favourites with jockeys who consistently beat a high percentage of rivals." From there, you can adjust these criteria and add more filters to be selective.
We recommend keeping your filters broad or using a limited number of metrics. While specific combinations may have worked in the past, future results rarely fit such precise ranges. Broad filters (or fewer narrow ones) tend to be more reliable.
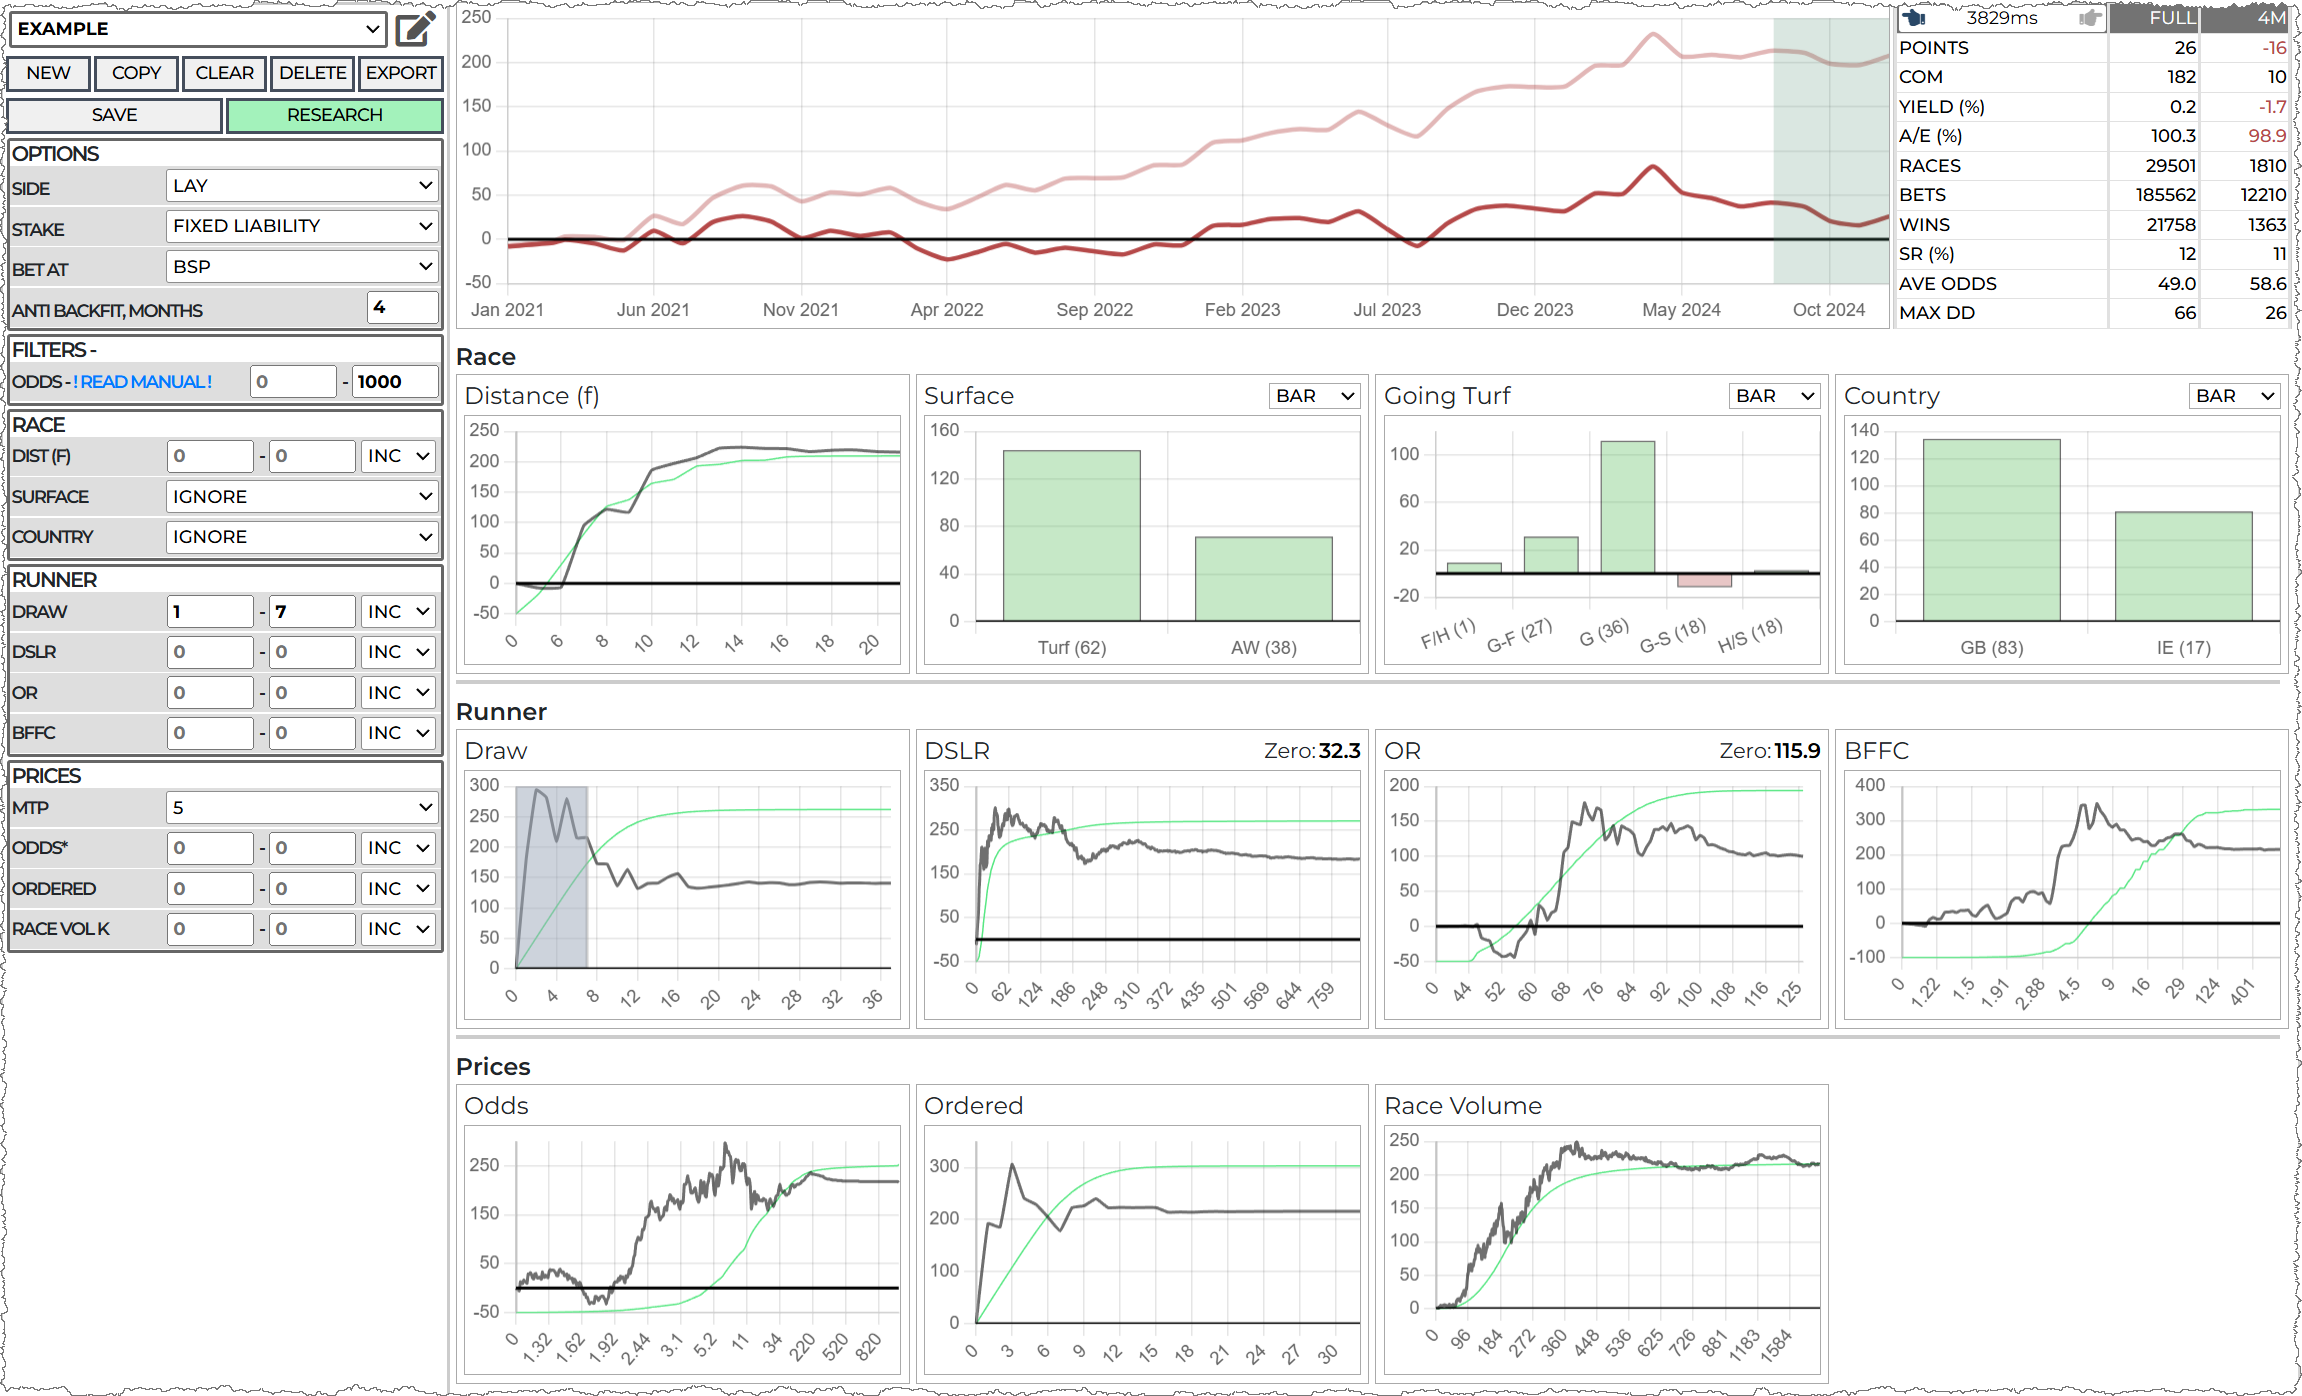
In this example I'm going to start by looking at low draw laying system; I select 1 to 7 for the draw, even thou this is not the peak, I don't want to be over selective. This look like about 200 points or so (before commission) and covers about 50% of potential bets - so its a nice start.
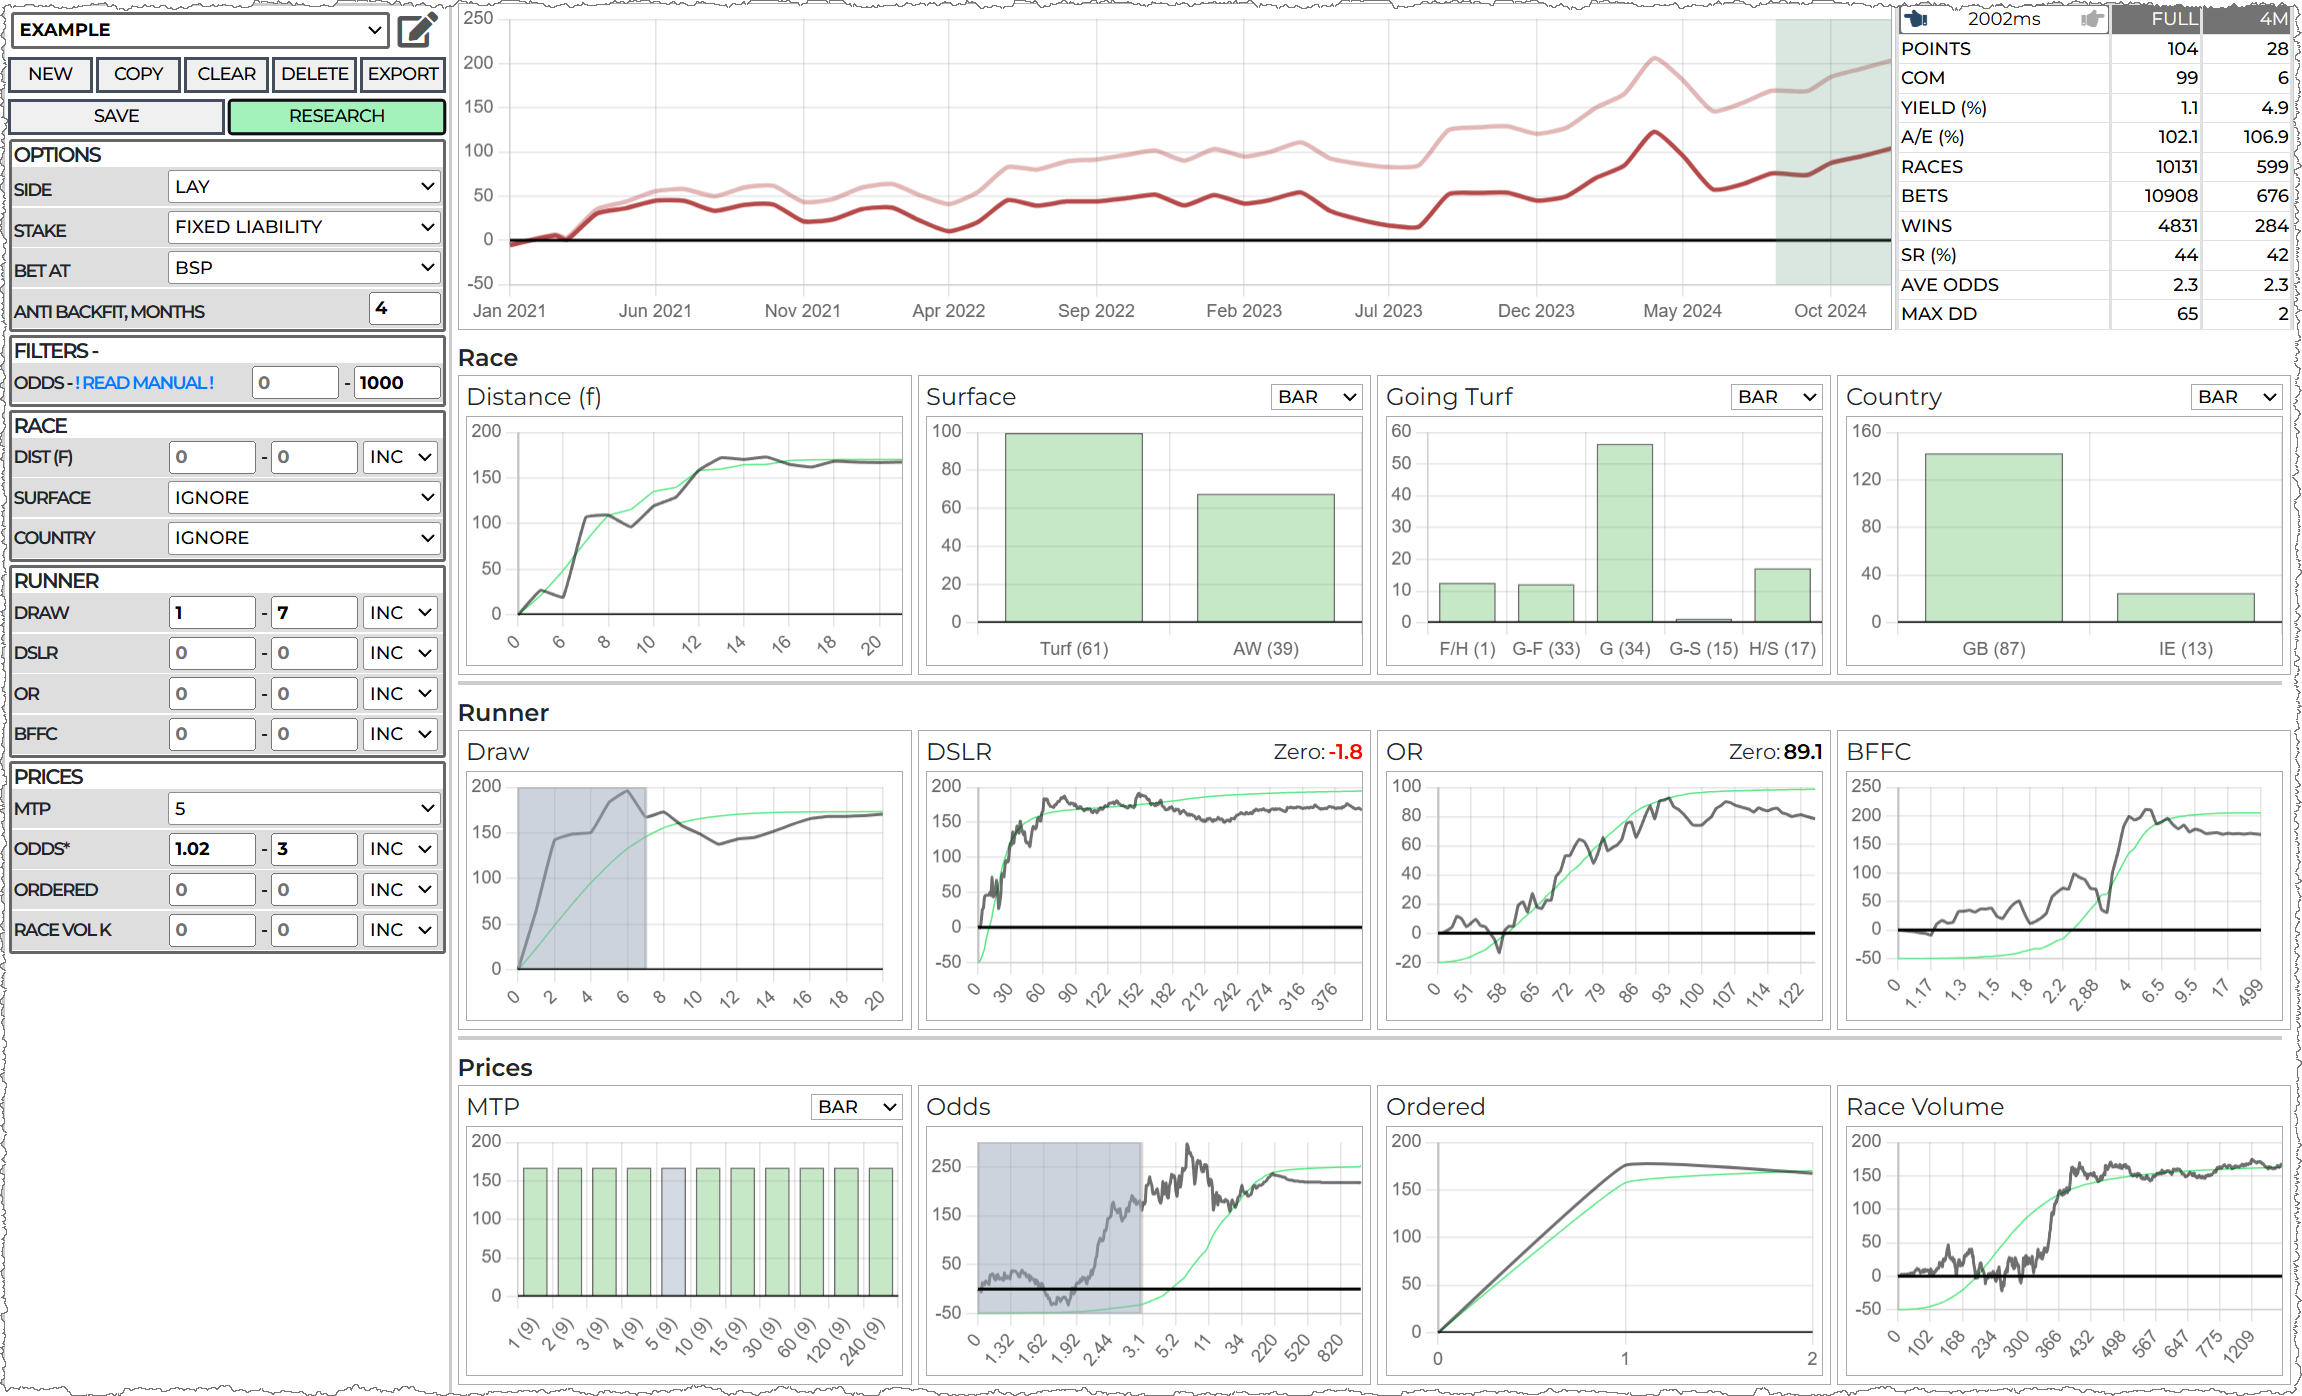
The chart that now pops out at me the most (which I was hoping for) is odds. I see a decent rise in profits in the low odds end of the market. I start at 0 (1.01) for now as, again, I'm not trying not to over fit the stats. The max value I choose is 3 (for now) as this looks like a decent up trend with a very low rise in the green line - which means a lot of profit gain over a low number of bets. Remember - we can always adjust later - no need to get over focused right now.
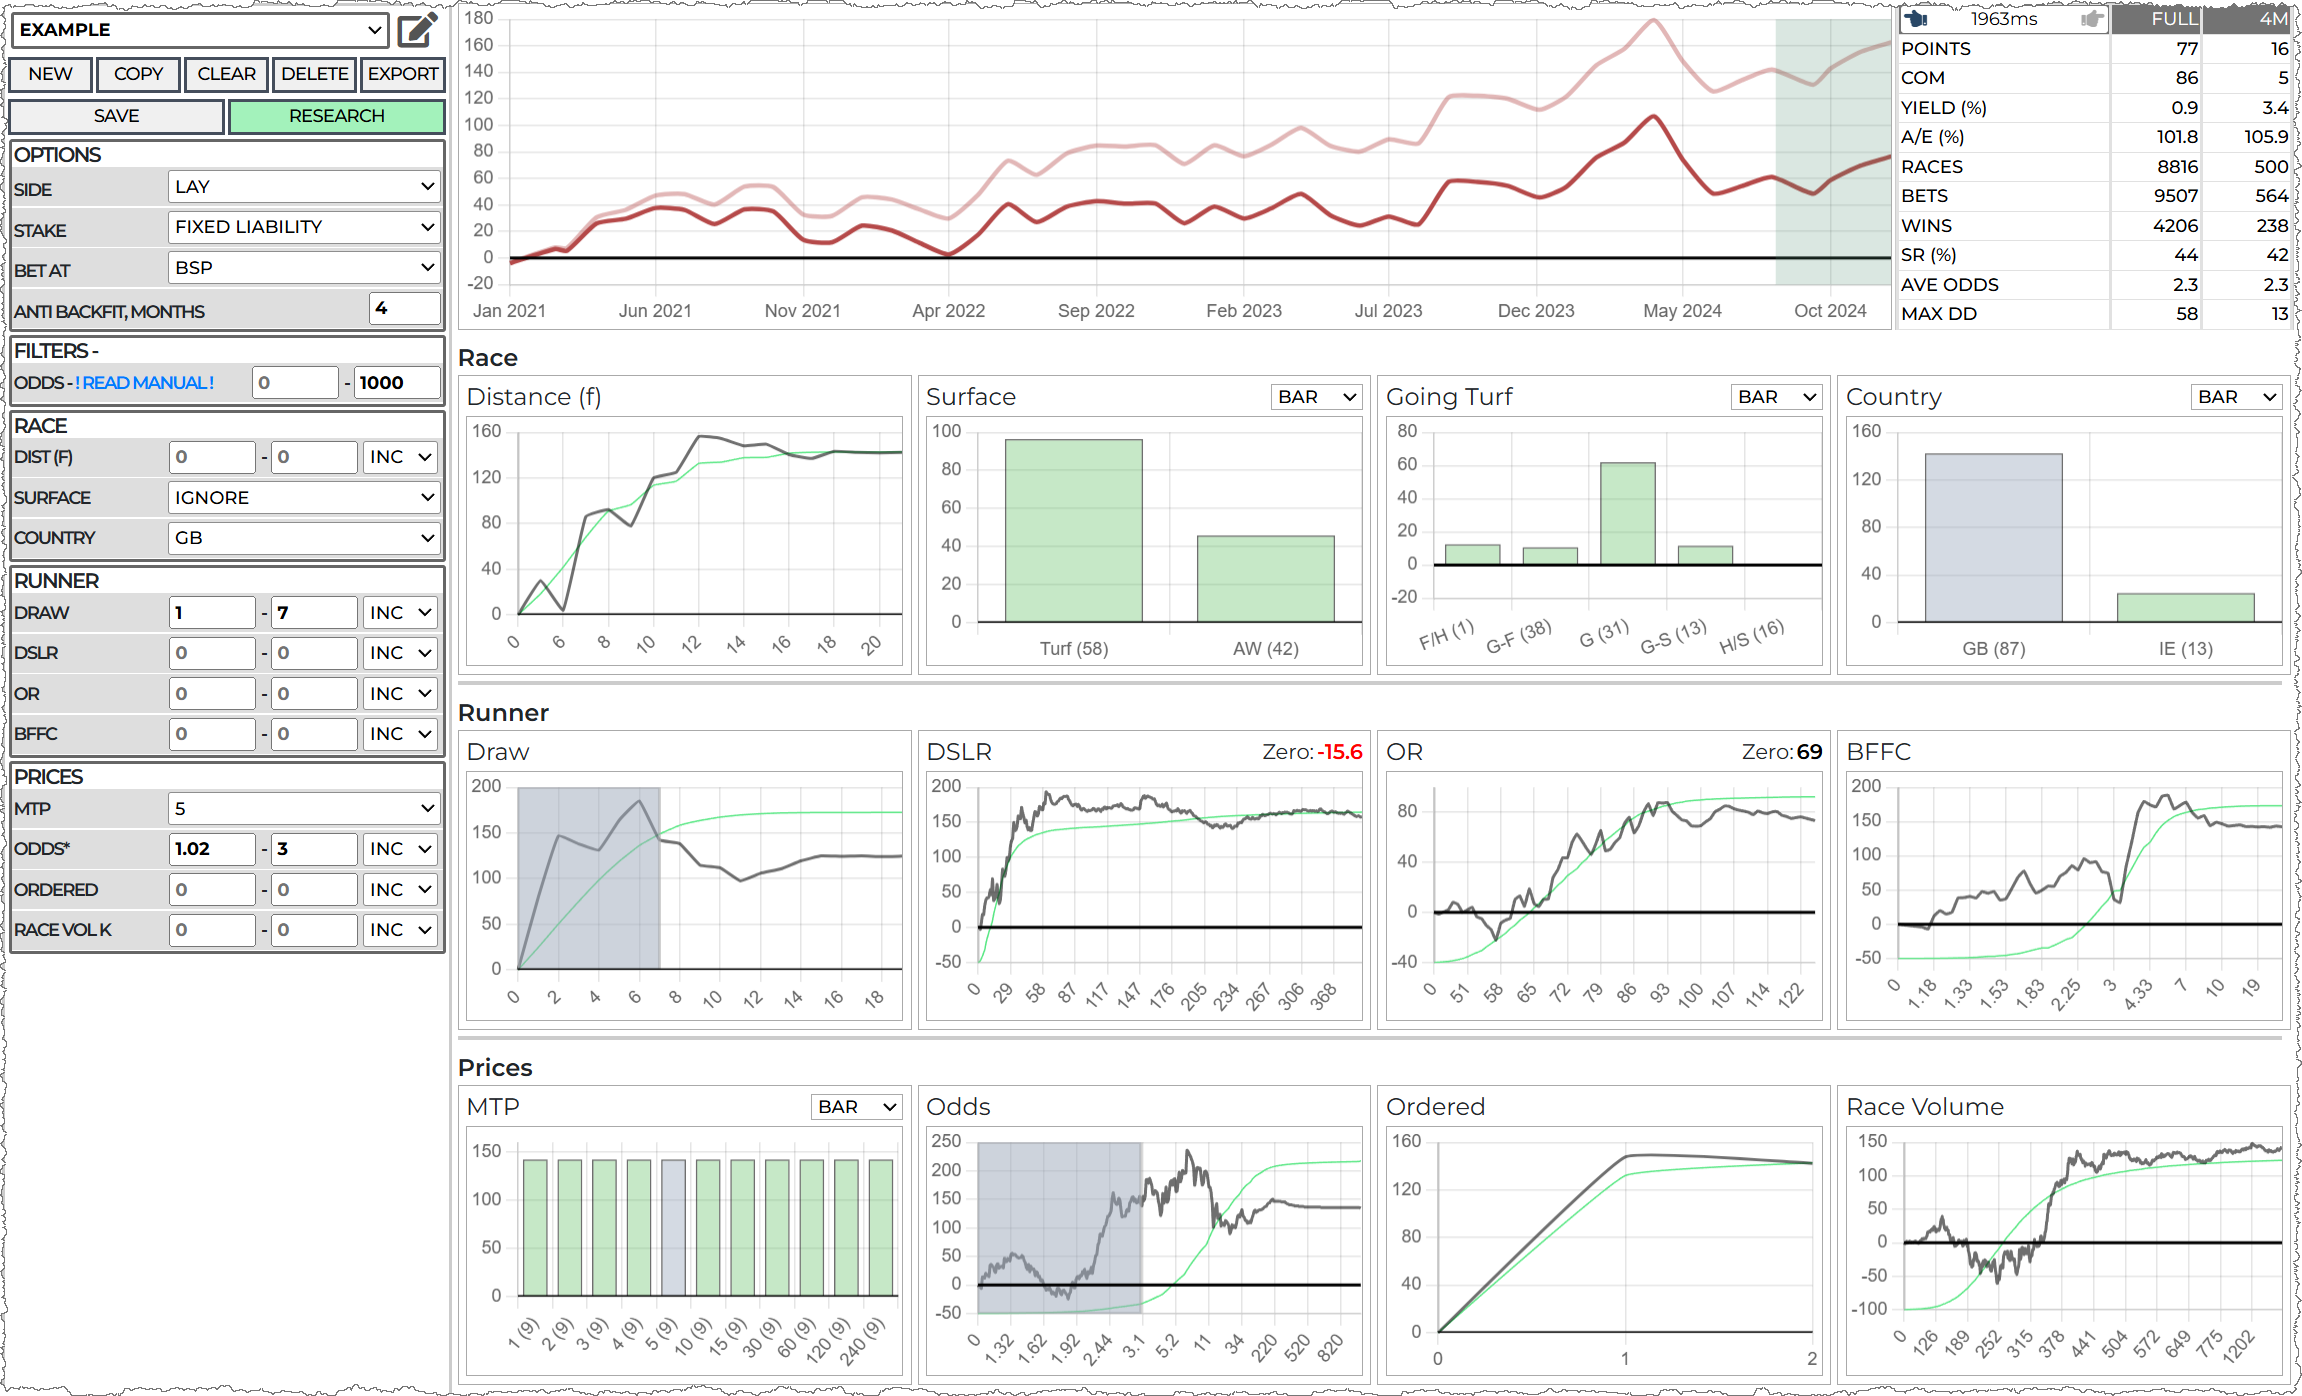
At this point I decide to make this a GB only system, we can always come back and make another one for IE if we want, but GB and IE races can differ quite a bit which makes it easier to do one at once, now we have this:
I'm still using BSP as my profit outcome for now, but I do have an odds criteria, so I'll switch to MTP. This is something I do when I have a few filters in place:
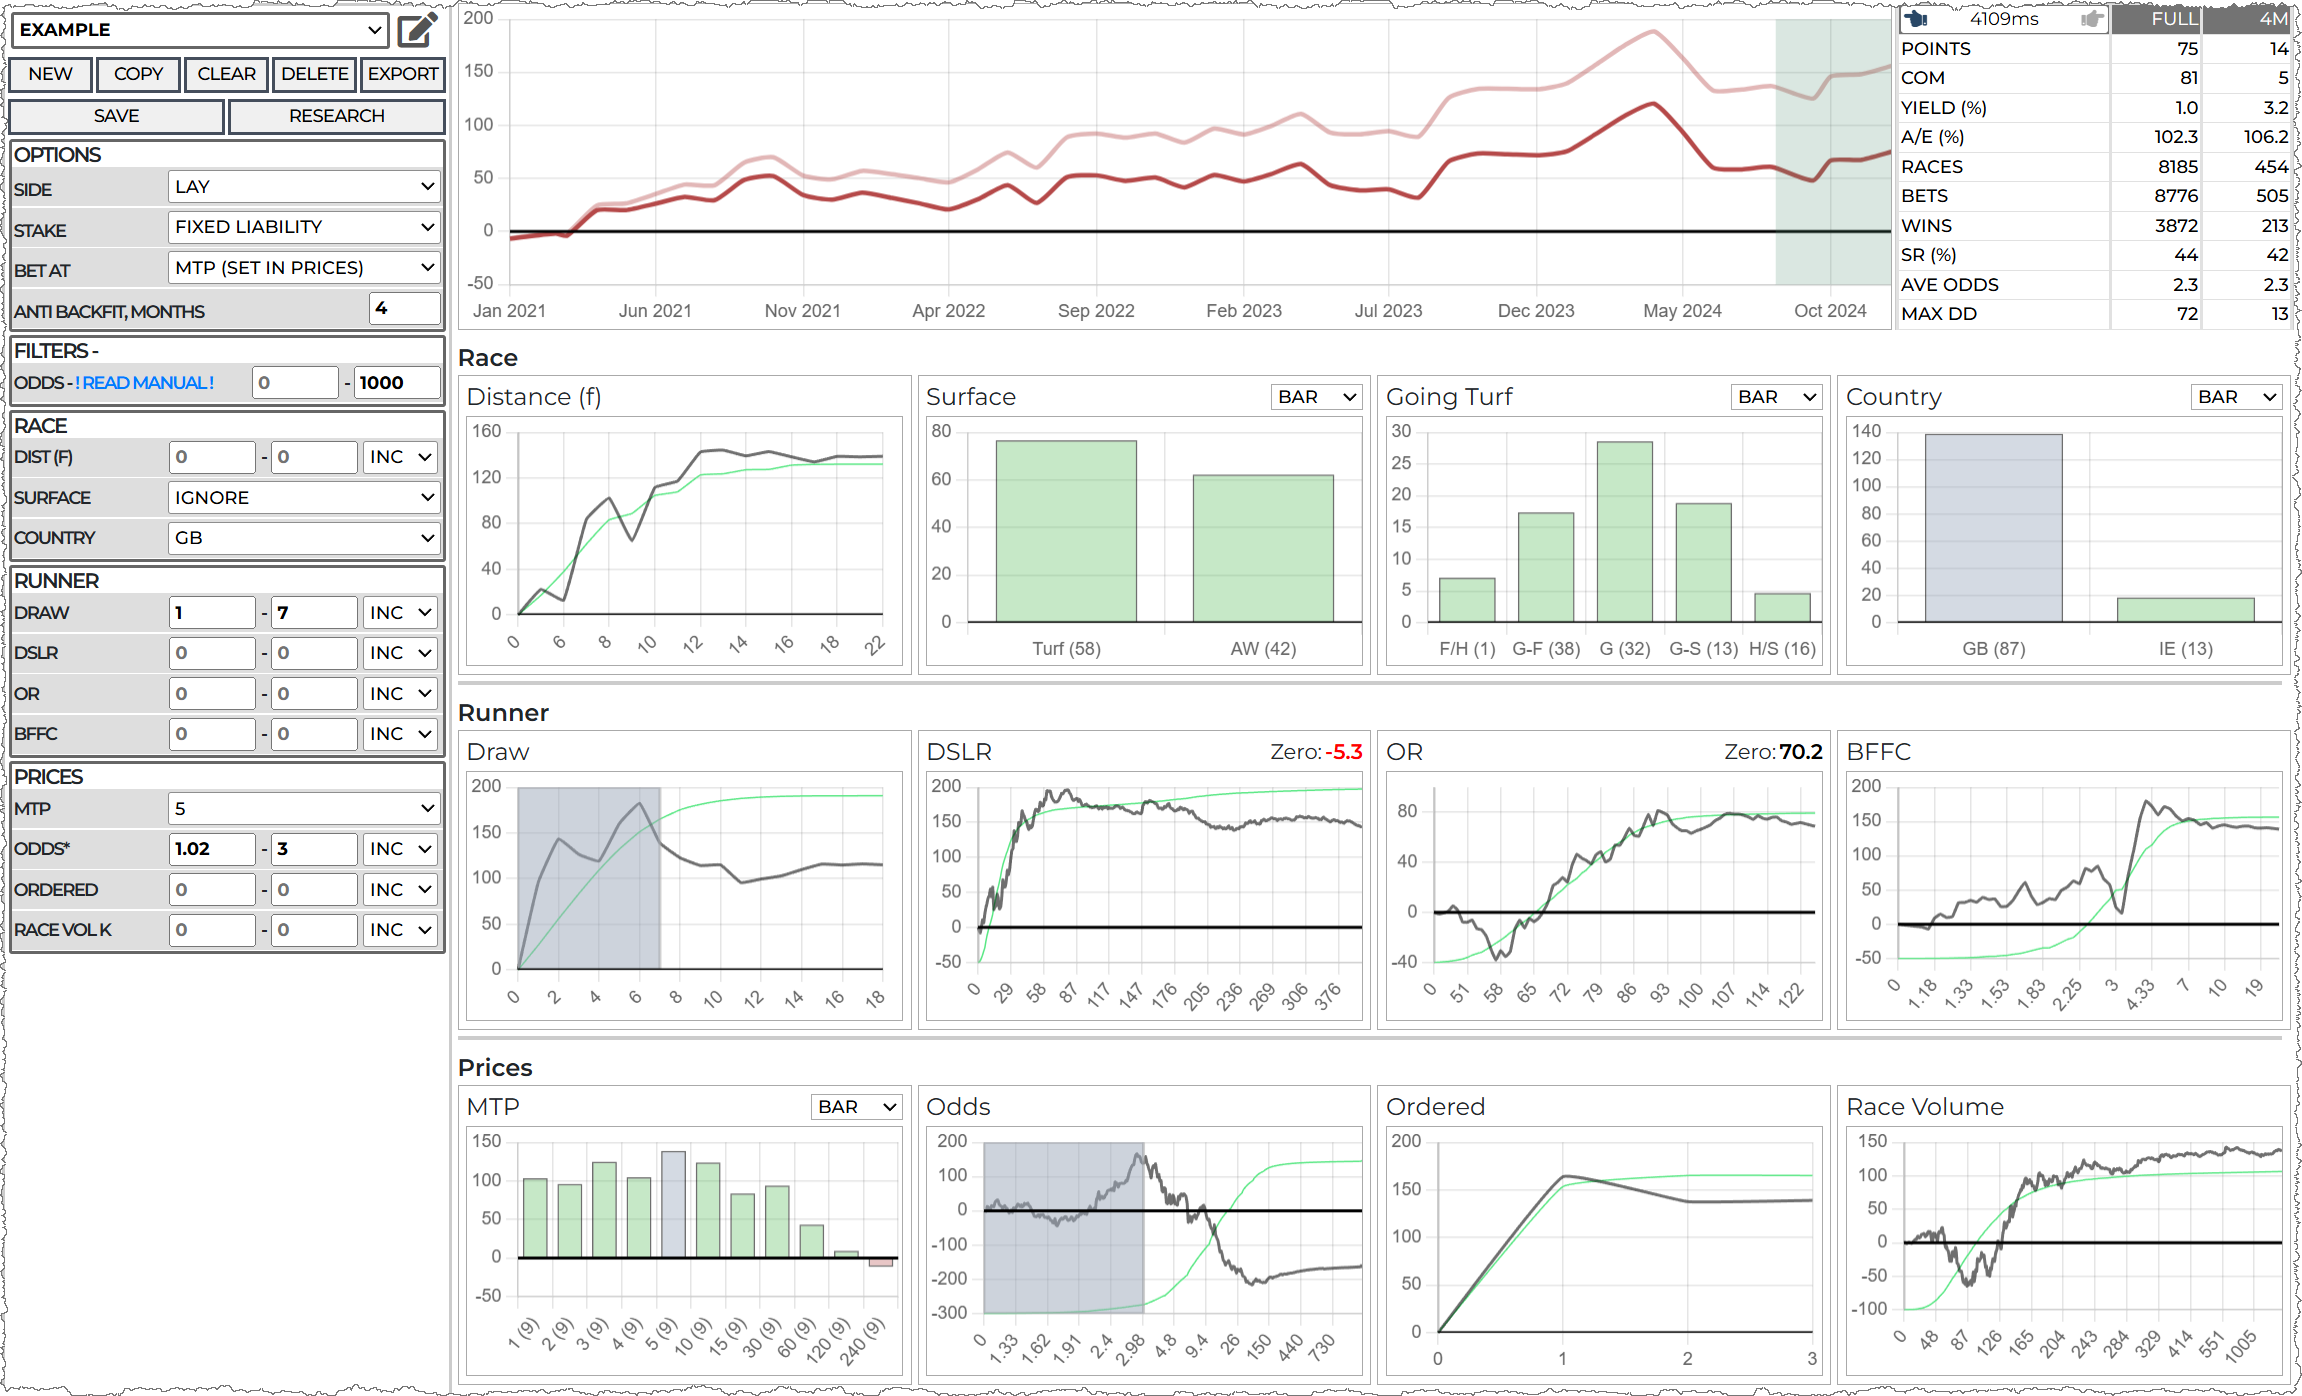
5 MTP is the default and happens to be the best time to pick the odds range and order the bet, so I'm happy to leave it as it is even though the profit has crept down slightly. I prefer MTP bets for lays as the min in £10 liability and I like to start steady and increase the stake steadily for new systems. I can always go back to BSP when I'm done to see what difference it makes.

It might look obvious to add a low DSLR of, say, 0 to 60. However, that covers most of the available bets, so we're not filtering anything out there at all. I pull the draw back to to 1-6. The data is telling me that might be a good idea and a low draw system was my intention, so I'm not doing anything unexpected
The P&L goes up and its looking more consistent, but I'm sure I can do a little better as the drawdown is looking a bit unappealing.
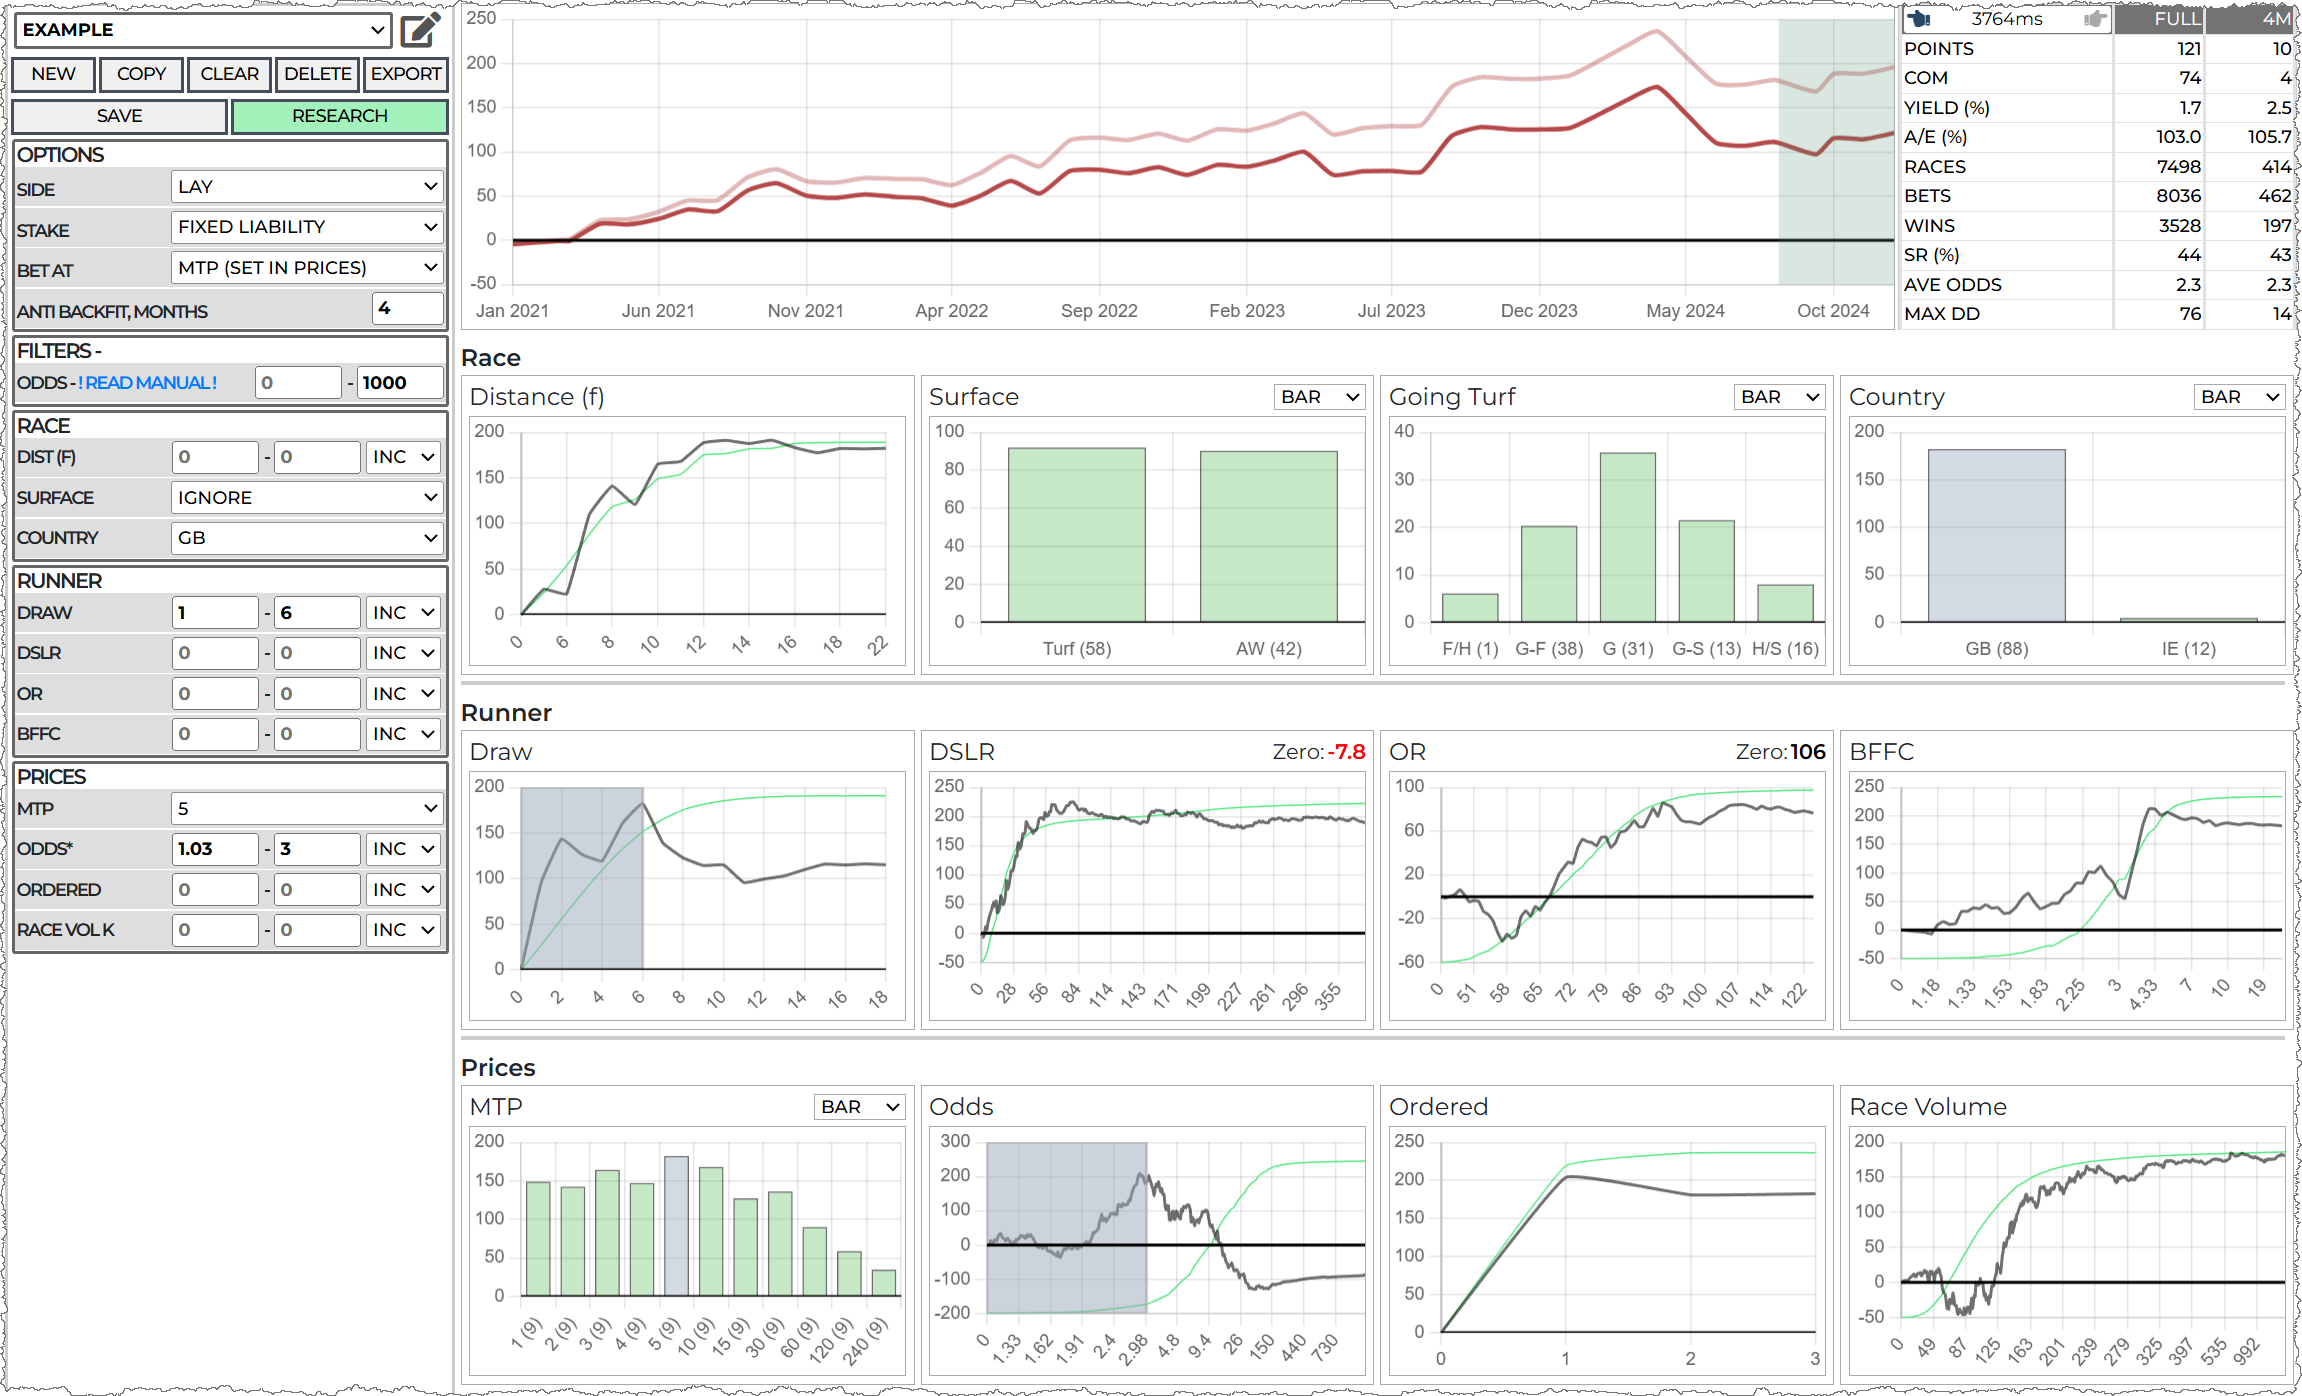
Turf and AW races are quite different in character. I tried AW but had more luck with refining Turf races in the end. Selecting Turf makes things worse but lets take a closer look:
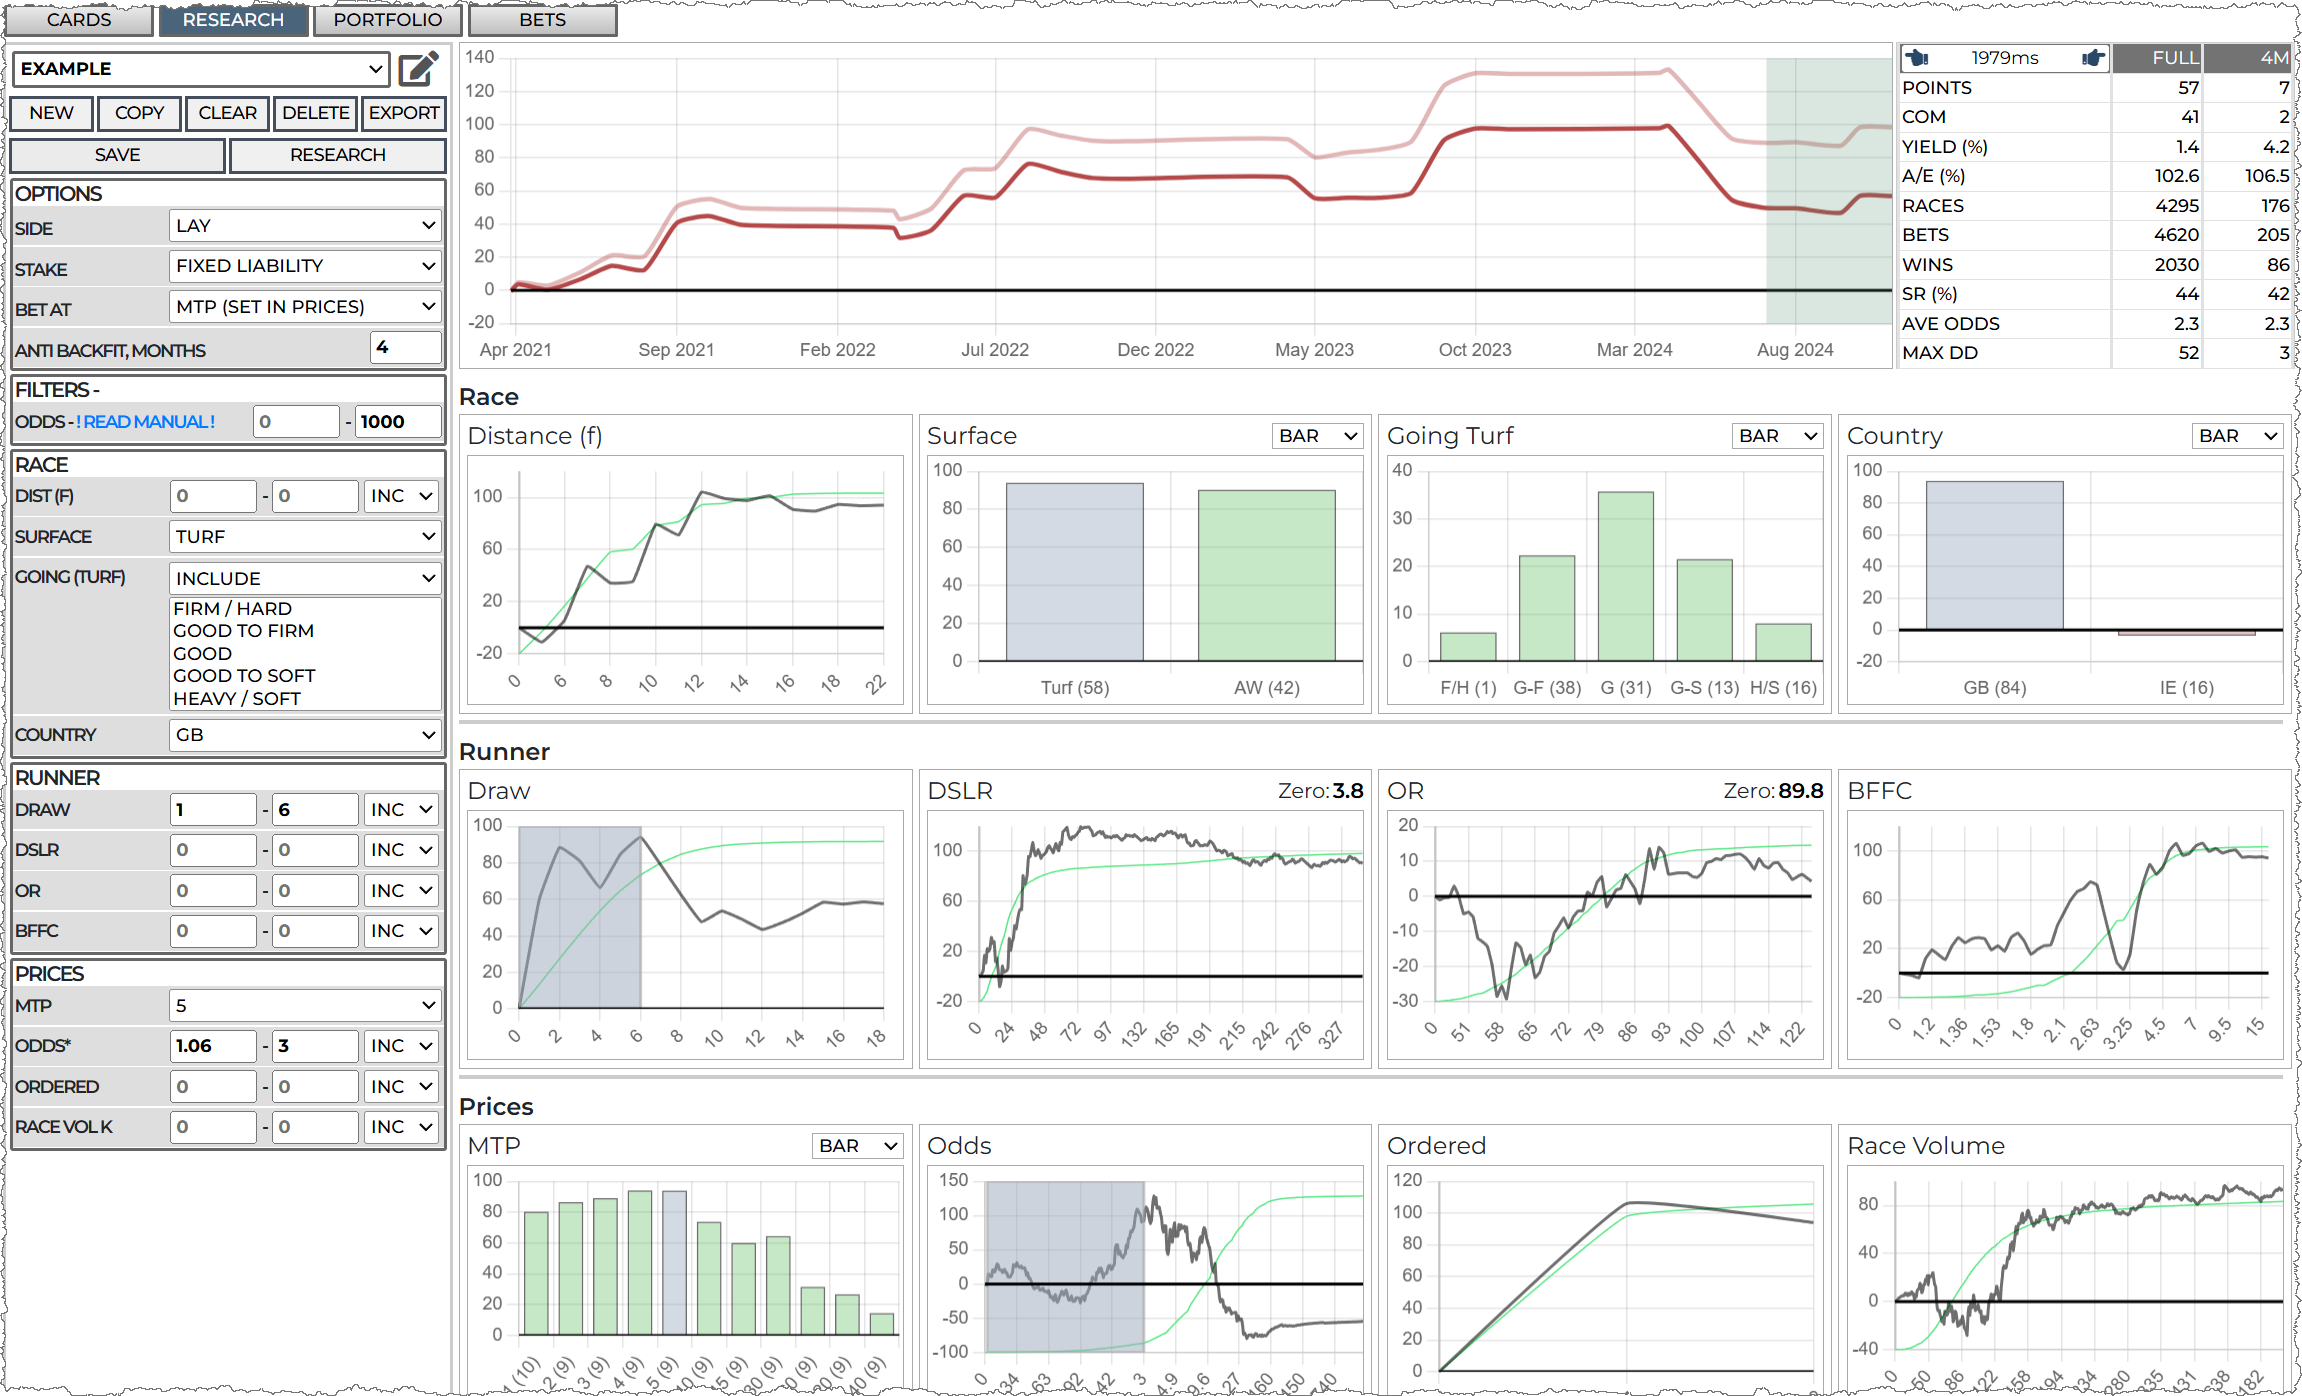
I'm now adding in a distance range, which is a bit speculative at this point, but this is what HP Research tool allows you to do!
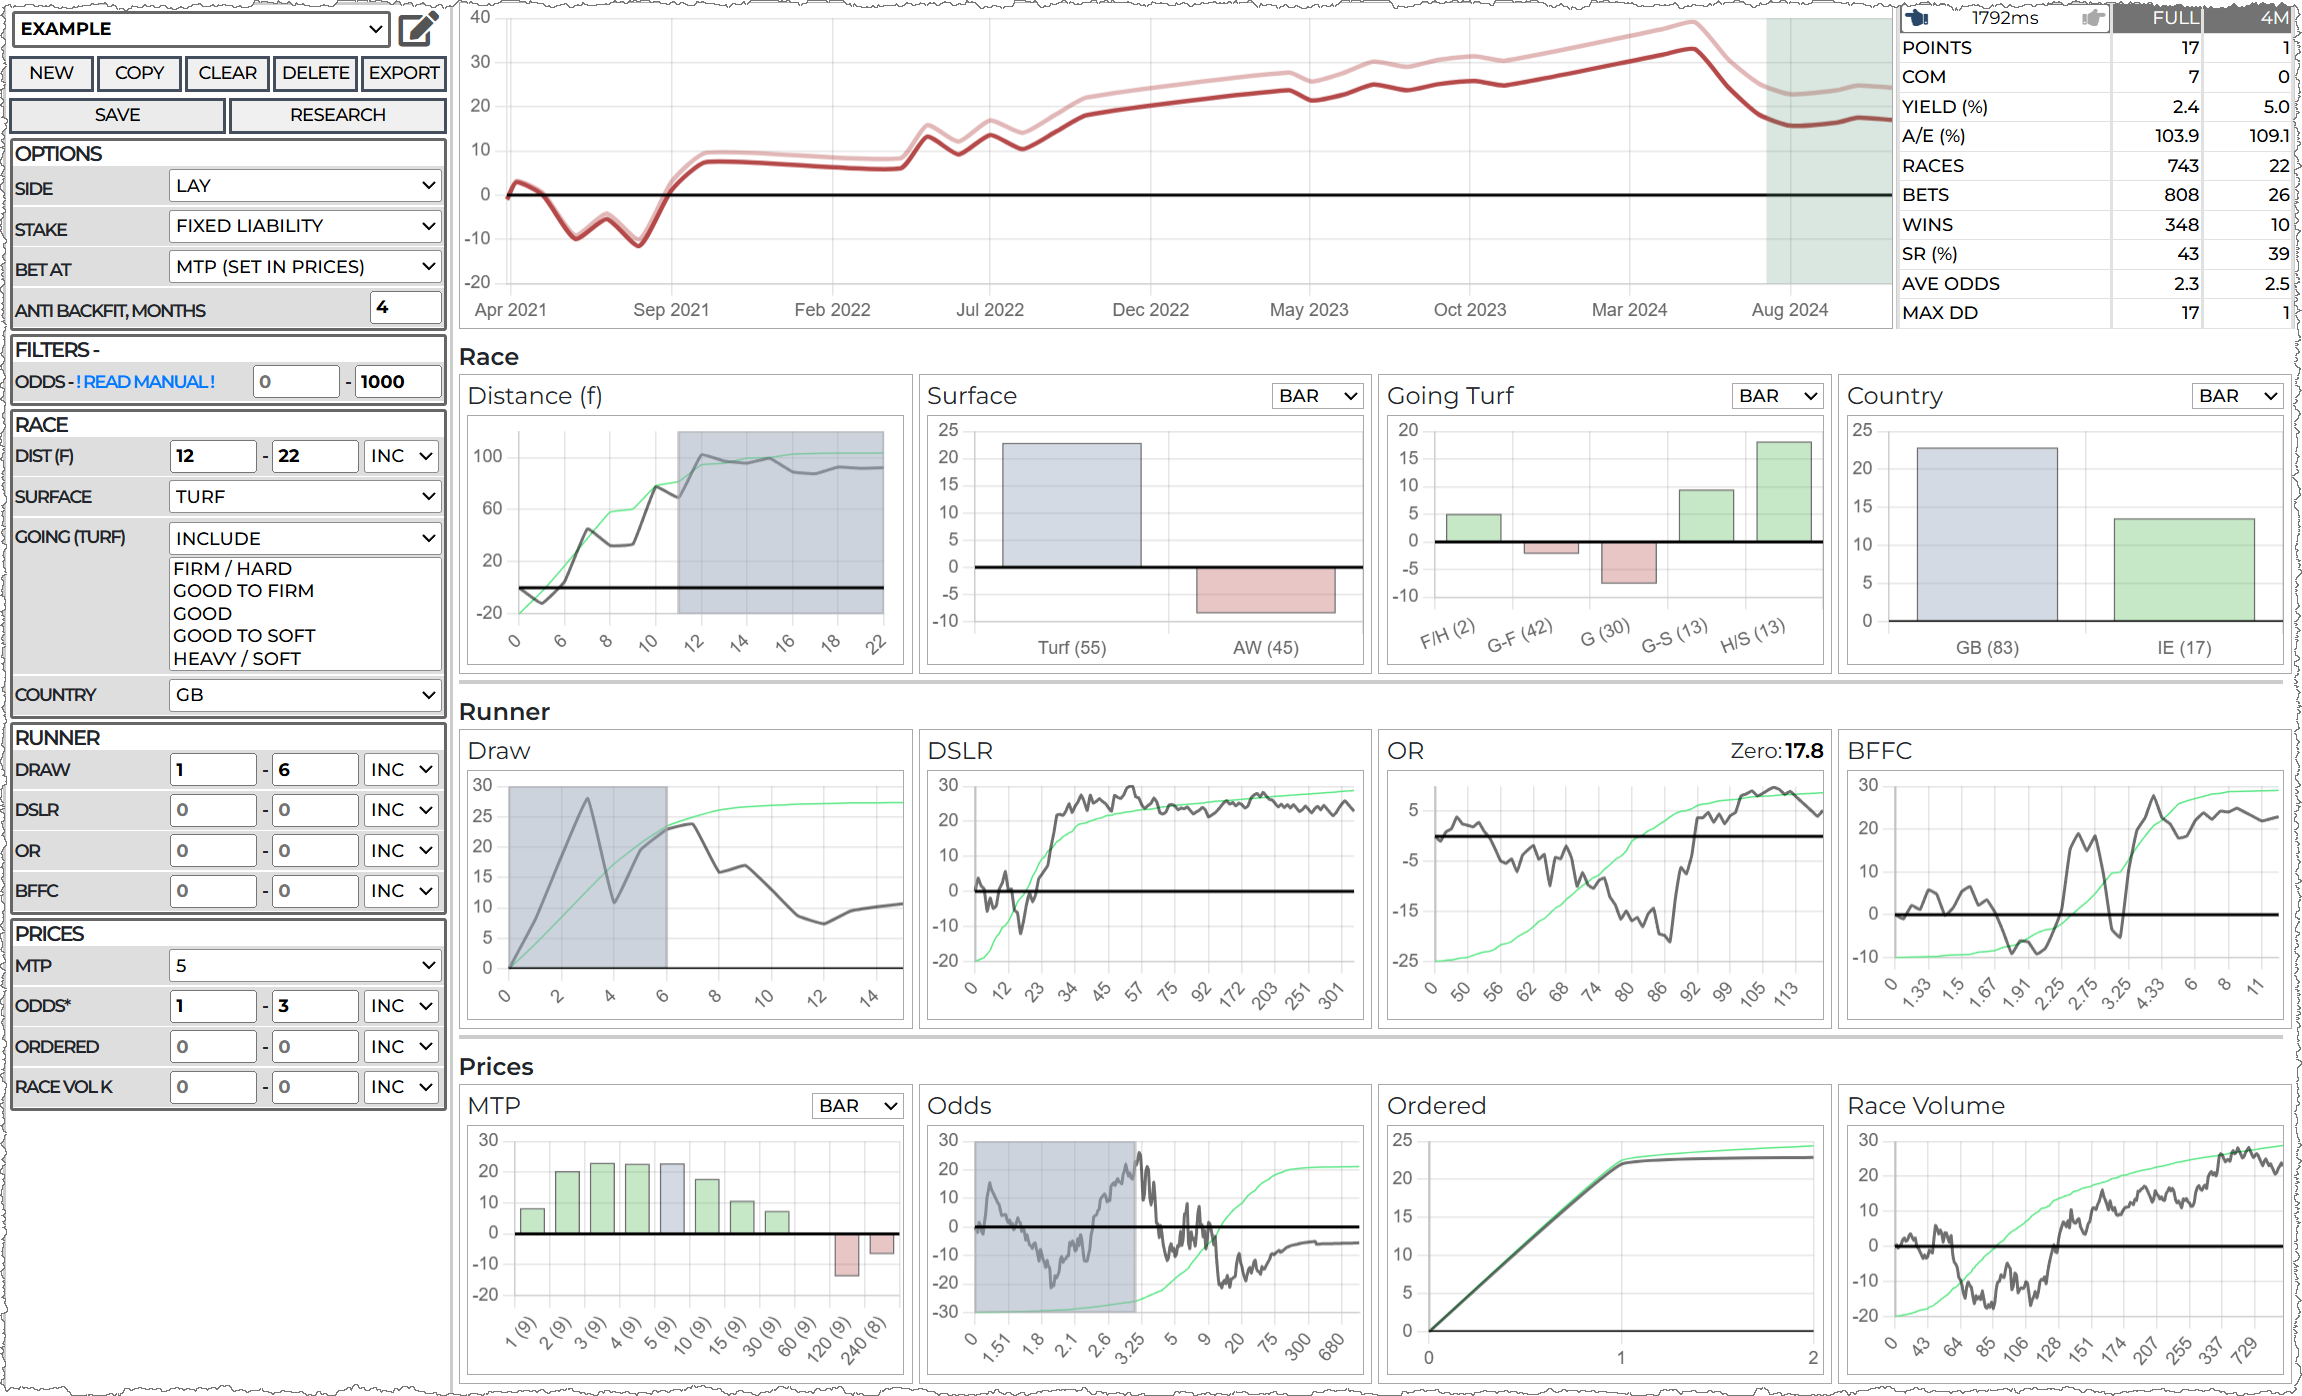
The MTP of 5 looks OK, but 6 is not great, so I shift it to 4 AND move the draw up to 7
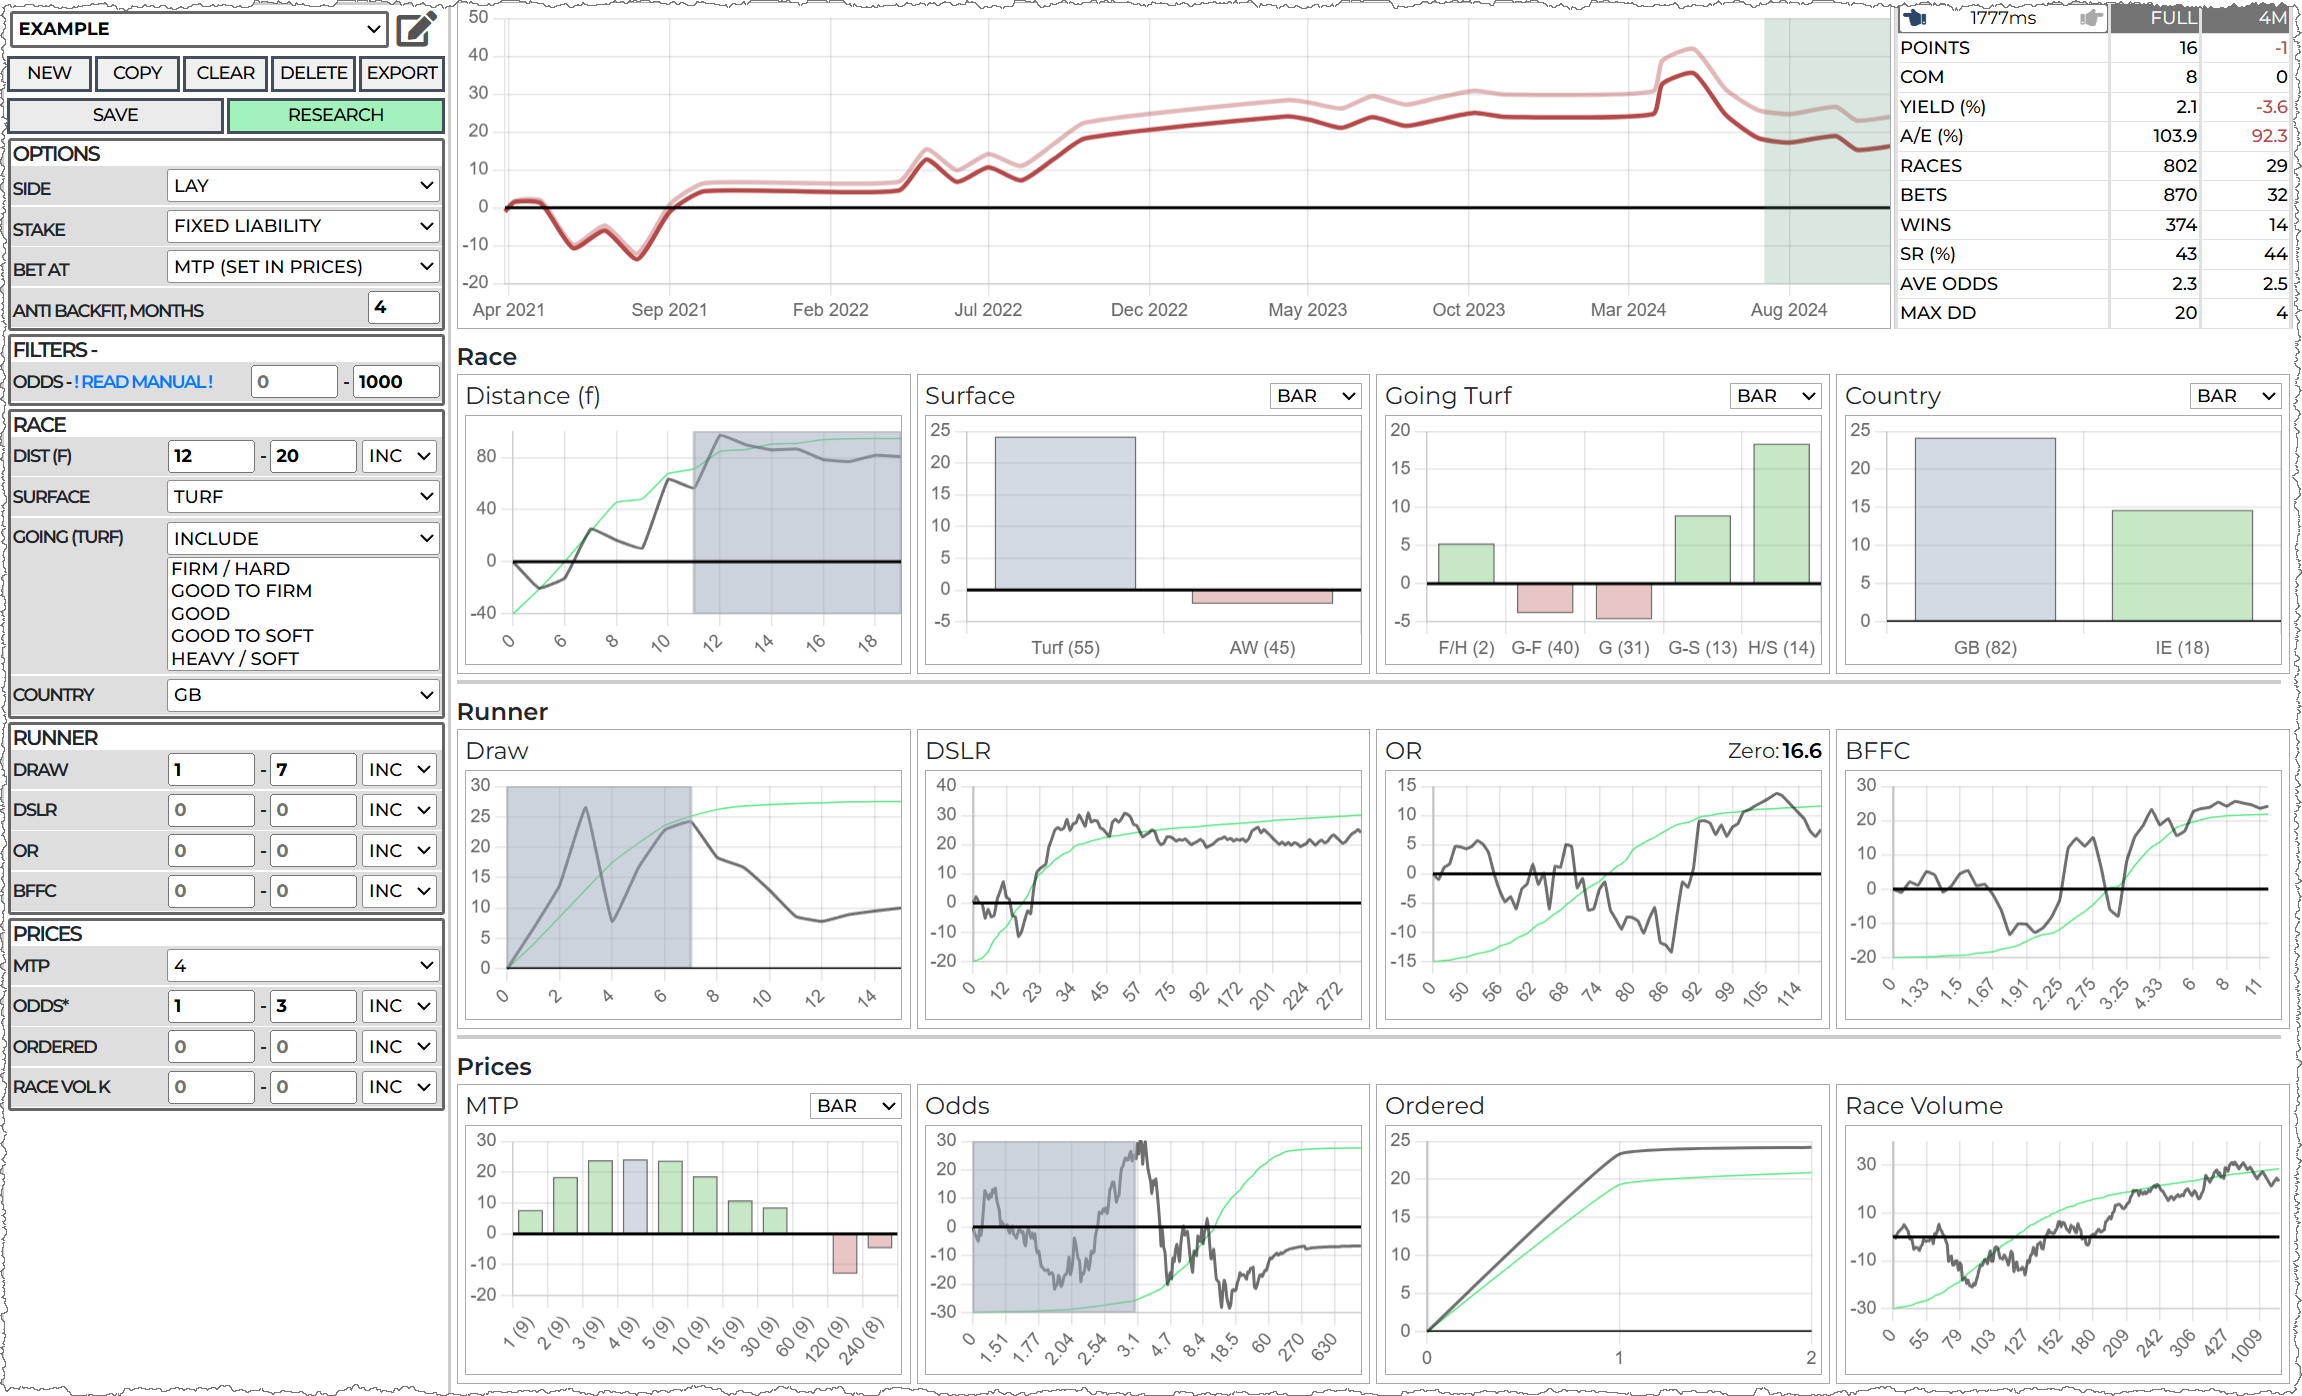
Try not to make more than two changes at once, one at a time is best but sometimes I push it a bit as I start to get a feel of a system. Here I pulled the distance down as it was a bit too restrictive and added the soft goings. Adding more distance will counter the reduction in bets from selecting a couple of goings.
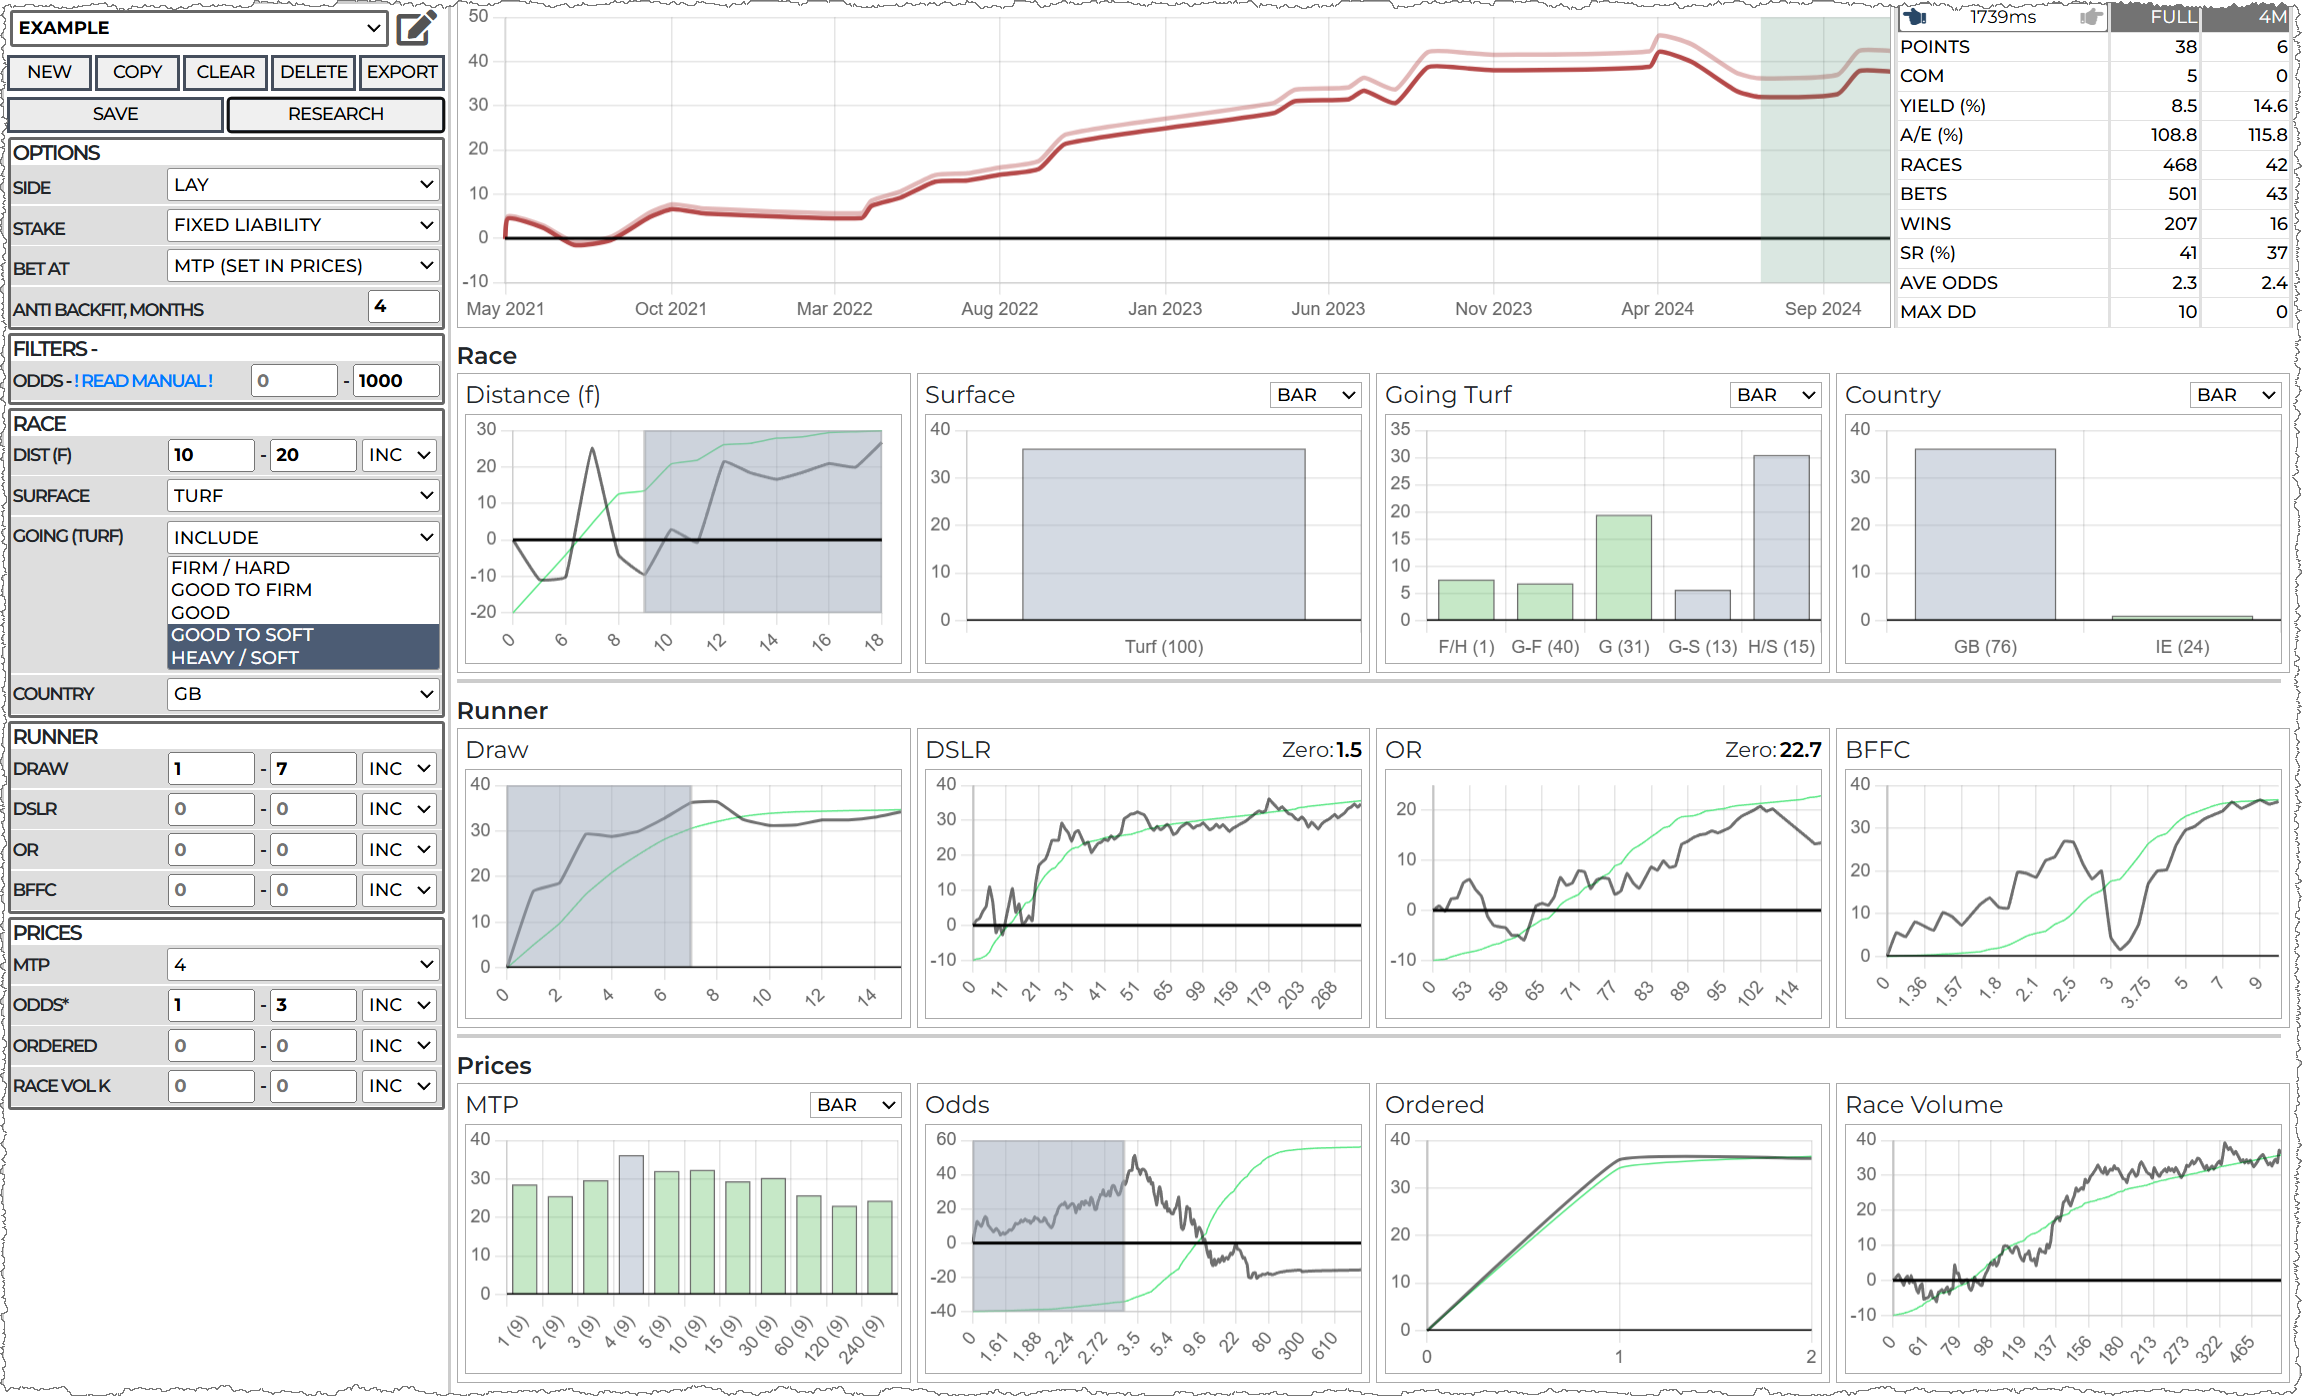
Because I changed two things at once its now highlighted Good Going as a good option to add, which is useful as this widens the system again, thus making it less fitted.
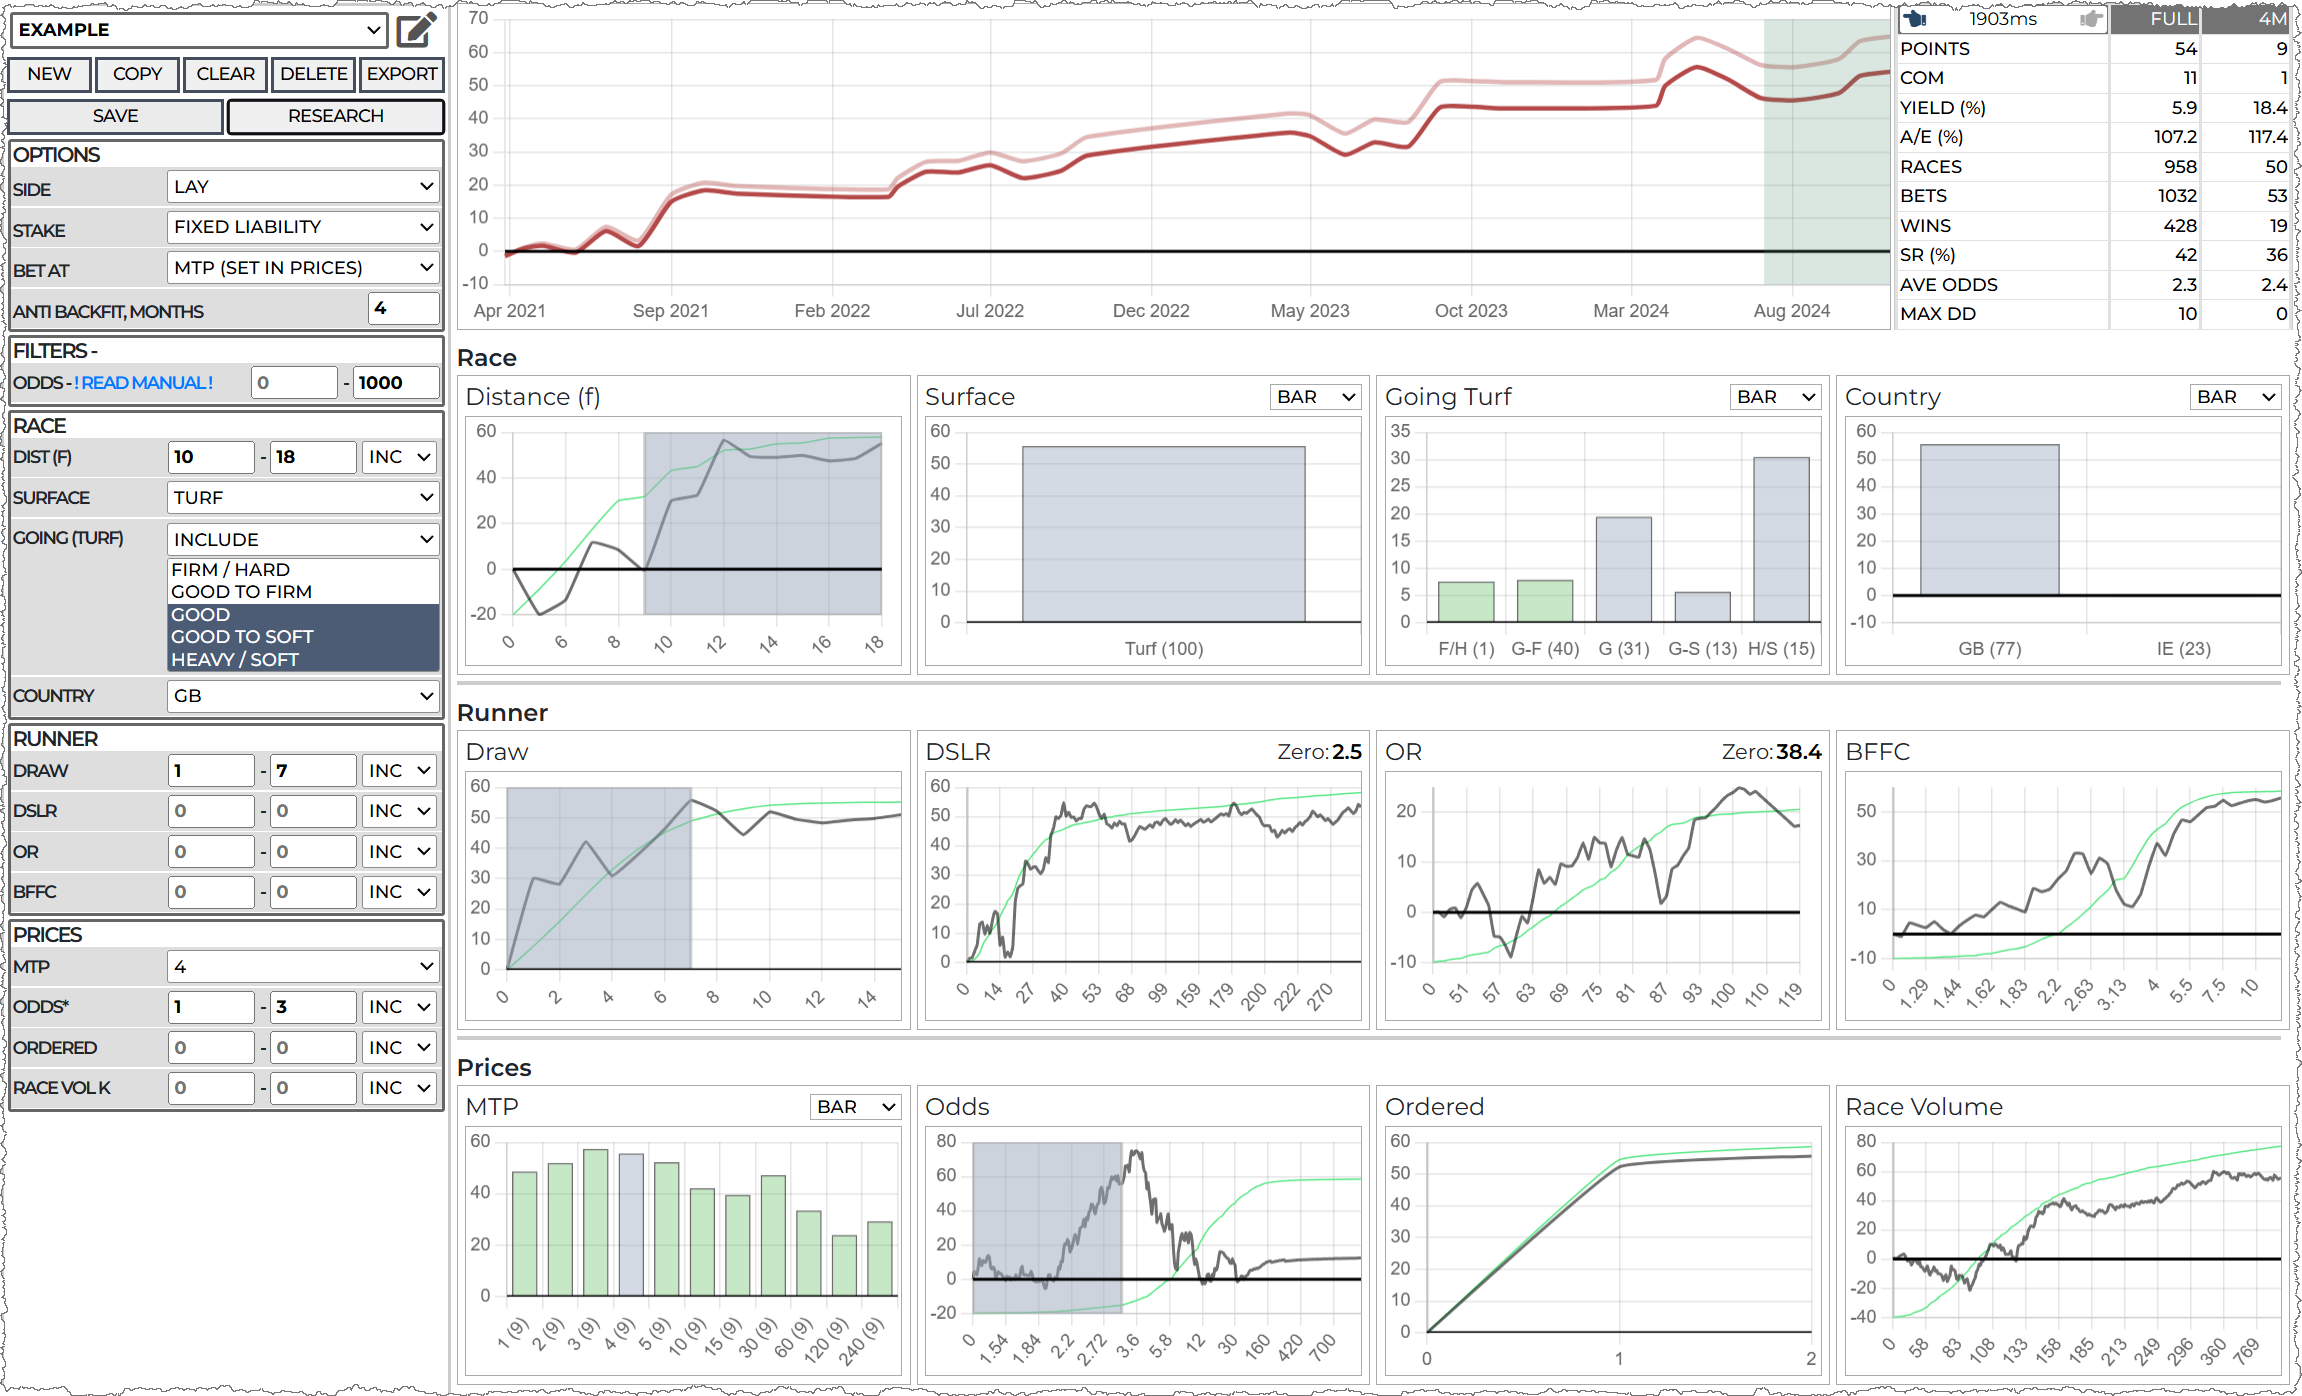
While creating this example system, I utilized the back / forward navigation many times to undo / redo changes, which is a handy feature to familiarize yourself with.
The entire process took about 5 minutes minutes. This example demonstrates how quickly and easily you can tweak filters using charts to visualize data and make adjustments.
There's quite a bit more than can be done here, such as BFFC and OR chart show most of the profit in the high end without covering the whole set of bets (check the green line). We could also add in some more filters like QPR for the jockey and any other horse, jockey or trainer stats.
Its best at some point - like at this stage to save the system, make a copy, and go forwards tweaking in different ways on the copy. Your opportunities are endless!
The portfolio page is a great way to combine your systems so you can see an overall P&L and drawdown. Having a mix of systems that focus on different concepts is good way to protect yourself from a reverse in trends in one or more of them.
Qualifiers
In the CARDS tab, you'll see a list of your systems above the days races.

Next to each system name are two numbers. In this example, the systems 'Fav Odds' has 2 (39). The 2 means there are 2 confirmed qualifiers for this system. The 39, in brackets, means there are a further 39 possible qualifiers for the rest of the day.
Clicking the shortlist name shows the runners for that shortlist
A green thumbs up: This is a qualifier
An Orange Hourglass: Is currently a qualifier if the odds stay the same at your set MTP.
A Red Question Mark: This might be a qualifier at the MTP time, but as things stand it isn't. (You can set not to see these in the cards settings)
Our Fav Odds System has these settings:
MTP: 120, Ordered: 1 to 1 (Fav Only) and Filters Odds range: 1 to 5
This will show only the favourites for races past 120 MTP, and for the races yet to reach 120 MTP it will show all horses that are currently odds of 5 or under.
Setting a range in the filters vastly reduces the qualifiers list to a more manageable size.
If you wish to make scheduled bets on these horses in advance, you can do by clicking on the odds and selecting the system name. Only the qualifying bets will be matched at the MTP you have set.
You can export your system and qualifiers in various formats and for various uses. Click 'EXPORT' in the Systems operations to open the exports options:
You now have options to choose from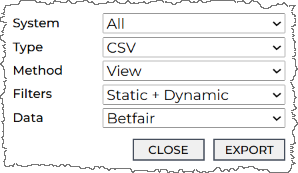
System:
Choose ALL, or select one of your systems to export.
Type:
Export Systems - save system data to serve as a backup or send to others
JSON - A technical format for computer programs to use
CSV - Comma separated - for spreadsheets
Excel - can only be downloaded in this format, not viewed in the browser window
Bet Angel - A format compatible with Bet Angel
BFBM - A format compatible with Betfair Bot Manager
Method:
View (in the browser window), or Download to your PC
Filters:
You may apply 'Static Only' or 'Static and Dynamic' filters to your qualifiers export. If you have a system with, say, class and odds, Static Only will result in all runners running in qualifying race classes irrespective of their odds. Static and Dynamic will also match your odds range, but we aware odds can change.
Data:
Just names - only: Feature names such as Course name and Horse name
Betfair - Includes Betfair market and selection Ids
Click EXPORT to download or view in the browser.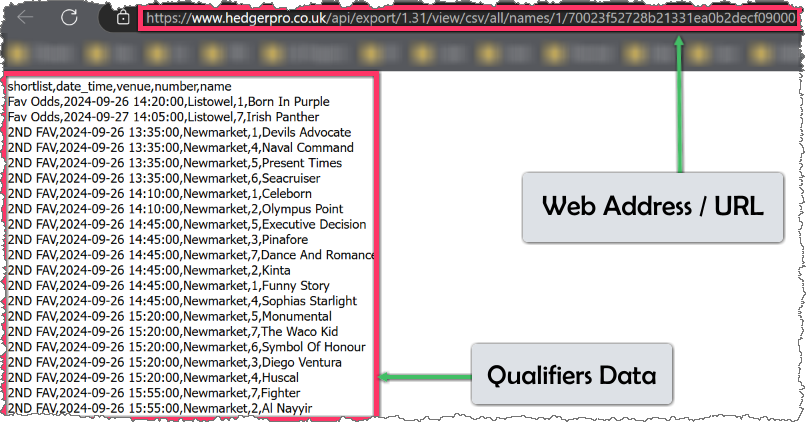
If you choose VIEW, a new tab opens with the URL in the address bar and the data on the page. You can save this URL in your favourites if you wish to go back to. You can also use this URL in a third party software so it can pull your selections when it needs to.
Exporting to BFBM
BF Bot Manager is software for automated and manual trading and betting on the Betfair betting exchange. The software has been approved and certified by each betting exchange security team, which means that it has passed all exchange API requirements and is an official Betfair NGAPI solution.
To run the BF Bot Manager you must have a Windows operating system with Microsoft .Net Framework 4.7 (all newer systems have that), a reliable internet connection and at least 2GB of RAM memory.
For the software to work, your computer must be up and running all the time. It must not go into sleep mode, standby mode or hibernate. Your computer must also be connected to the internet at all times. Alternatively you can use a VPS - we recommend Windows VPS - Winity for this.
You can use the software to load any exchange market, place Back or Lay bets manually or create your own bot/strategy that will automatically place bets by your own rules. There is no limit on the number of strategies that you can create.
BF Bot Manager is developed and marketed by Sodens Ltd and can be downloaded at www.bfbotmanager.com.
Hedger Pro has been adapted to allow automated system / tip integration into BF Bot Manager. This section details how to; create the upload from Hedger to BF Bot Manager and to then set it up to place bets from your Hedger Pro system qualifiers.
1) Get the Hedger Pro System Link
On the SYSTEMS tab click EXPORT (as above) and chose the following in the options: ALL (or a single system), BFBM, View, Static Only, Betfair.
'Static Only' only considers filters that do not change. This includes ANY odds related filters in the prices section AND number of runners and going. You must add these to your BFBM strategy yourself.
Your web browser will show load the days qualifiers under your unique system URL:
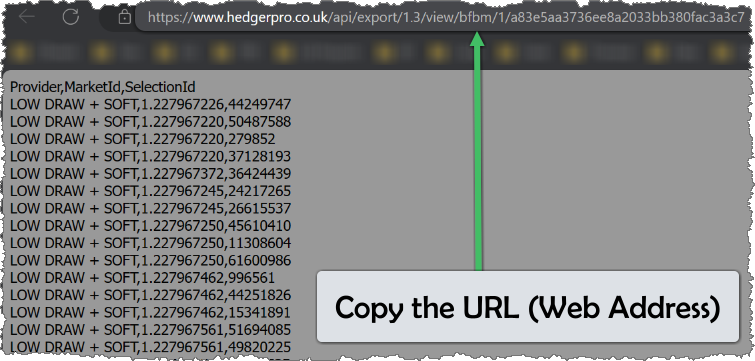
Check there are qualifiers (if you think there should be some today), then copy the URL from the address bar.
In BFBM, click 'Mange Tips'
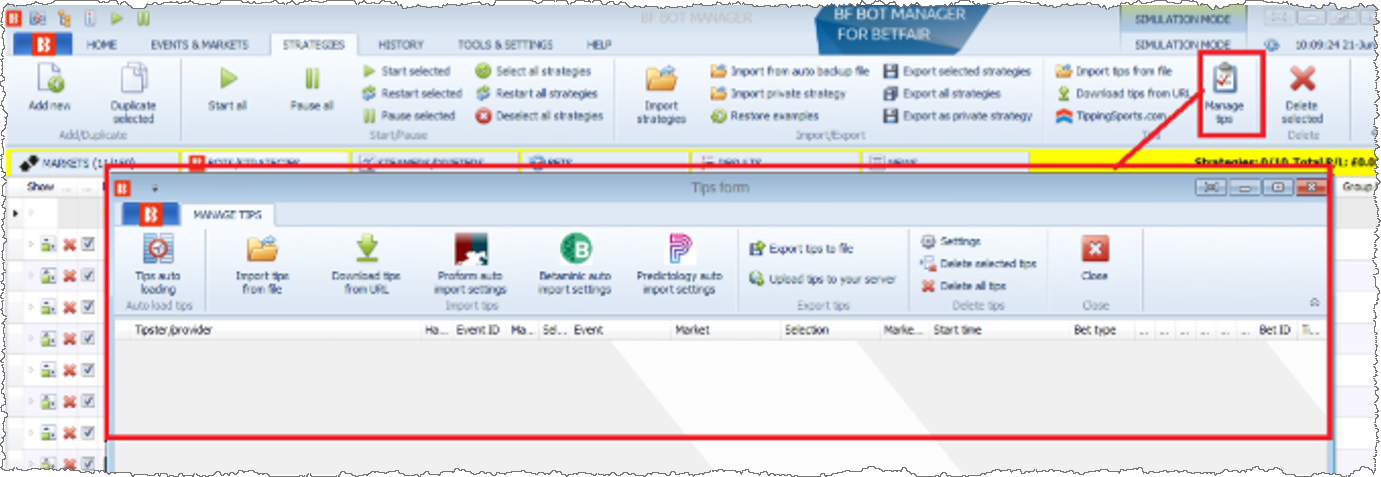
Then, click 'Tips auto Loading' in the 'Tips Window':
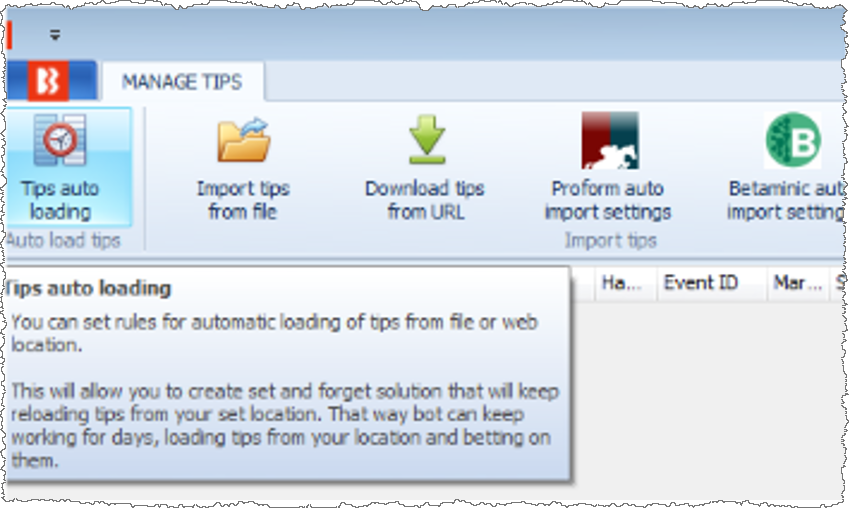
On this dialogue box you will add in the URL copied from Hedger Pro. The example below shows how the hedger system: “1) BFBOT example” was
incorporated, the same process would be used for “all shortlists” if you choose to export 'All Shortlists' from Hedger Pro

Please ensure that you tick the active box – if you don’t tick it your tips wont load, also please ensure that tips from Hedger Pro are loaded in once per day (or no more than once per hour) to ensure there is not excessive load placed on the Hedger Pro servers. If your systems are refreshing too fast they will be throttled by our export systems.
The screenshot shows an example of tips being loaded successfully
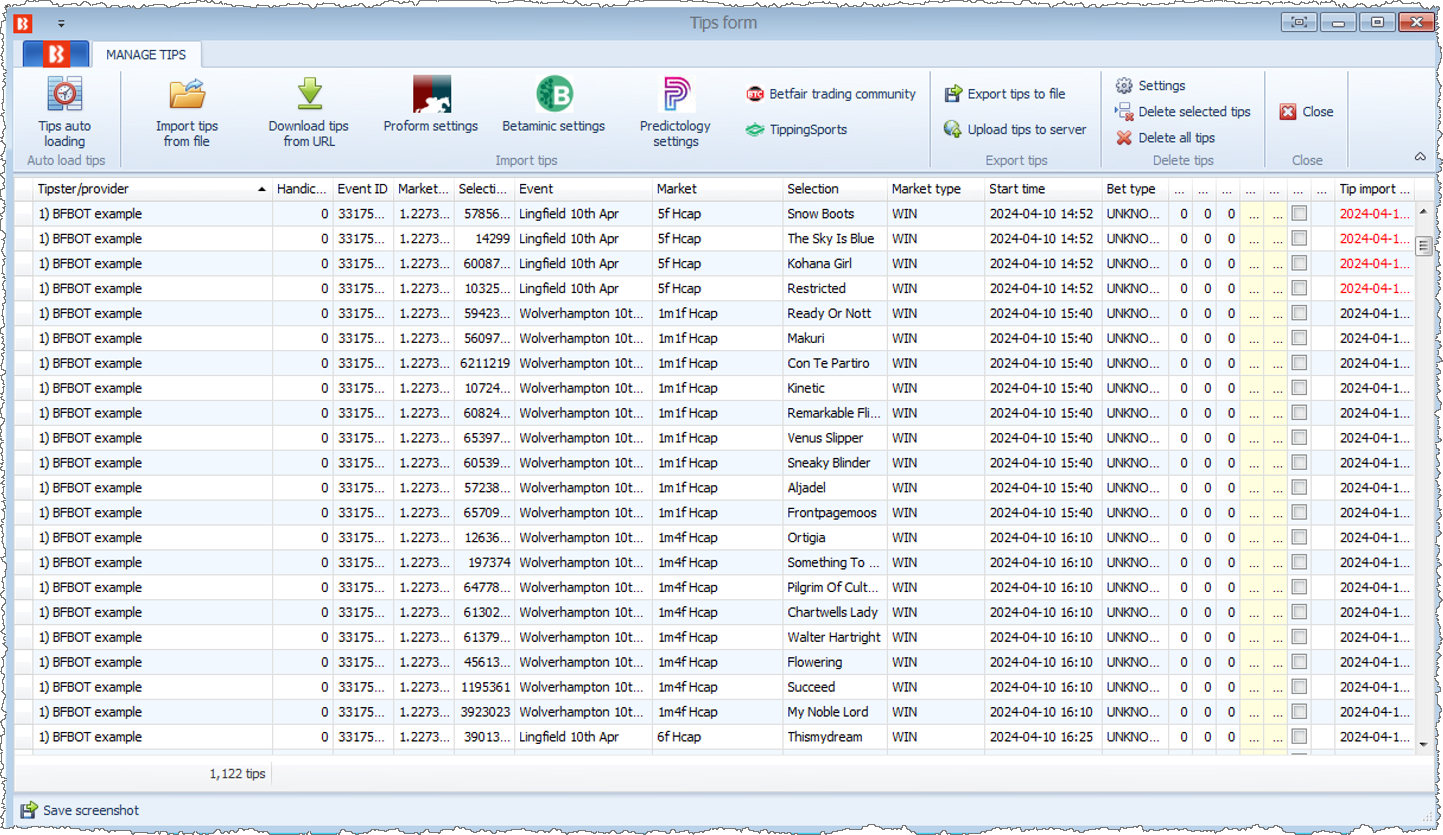
You should exclude any metrics that might change during the day from Hedger Pro system and let BFBM handle to filtering for these, these include:
Odds, Fav Odds, Ordered (Odds Rank), Number of Runners (if you're concerned about this changing due to withdrawals) and going.