RESEARCH TOOL
Systems & Shortlists
Introduction
Hedger Pro has a powerful Shortlist Feature that allows you to filter the days runners by: performance stats, race characteristics, runner characteristics and price information. You can create multiple shortlists to view runners in one list, or see which runners in race cards that match any of your shortlist angles.
Our Research Tool builds on this by allowing you to see the profitability of different factors. This is done graphically, resulting in a very fast and efficient path to honing your new systems.
Your saved systems are then accessible as shortlists and can be exported to an automated betting solution like Betfair Bot Manager.
Getting Started
To access the Systems Research Tool, click Systems on the Races tab.
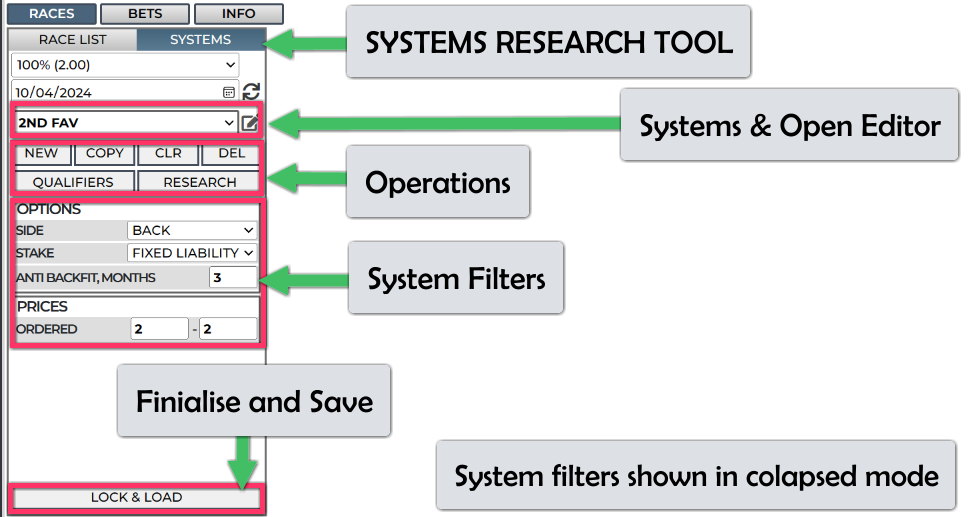
Operations
NEW (Create new system):
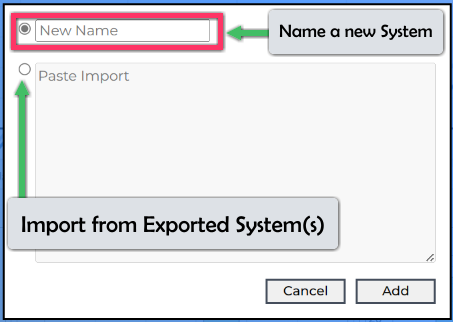
Simply name your new systems and click ADD. From here you can import one or multiple systems at once by pasting in the text from a systems export.
COPY (Copy existing system):
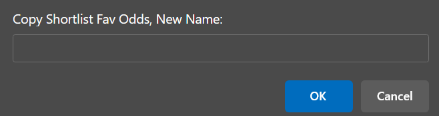
Copying systems (here I'm copying a system called 'Fav Odds') to a new one. This is a very handy feature - saving you having to re-enter filters.
CLR - CLEAR - Resets default settings (Confirmation box will appear)
DEL - DELETE - Completely removes the system . This is NOT reversable, also a confirmation is required - to prevent accidental deletions.
System Filters
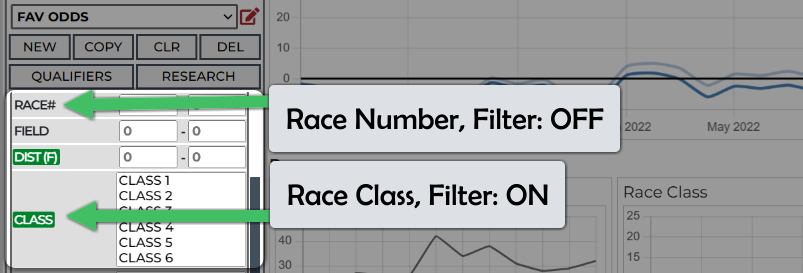
Shows all the available filters (like race class, going, runner stats etc), then choose the ones you want to see charts of.
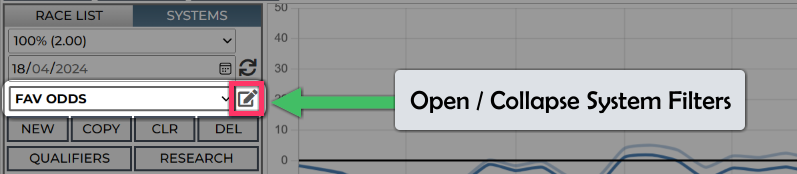
Click the filter name and it will turn green, if you enter any values it will become green automatically. When you click 'RESEARCH' the filters will collapse back to show you only the ones you have an interest in.
Finalise & Save (Lock & Load)
You can alter your system after saving it, but you should only do this when you are happy with your settings. Only after saving will the shortlisted runners reflect the new settings, also exporting to automated systems will then pick up on the new settings profile.
Graphical Analysis of Profitability
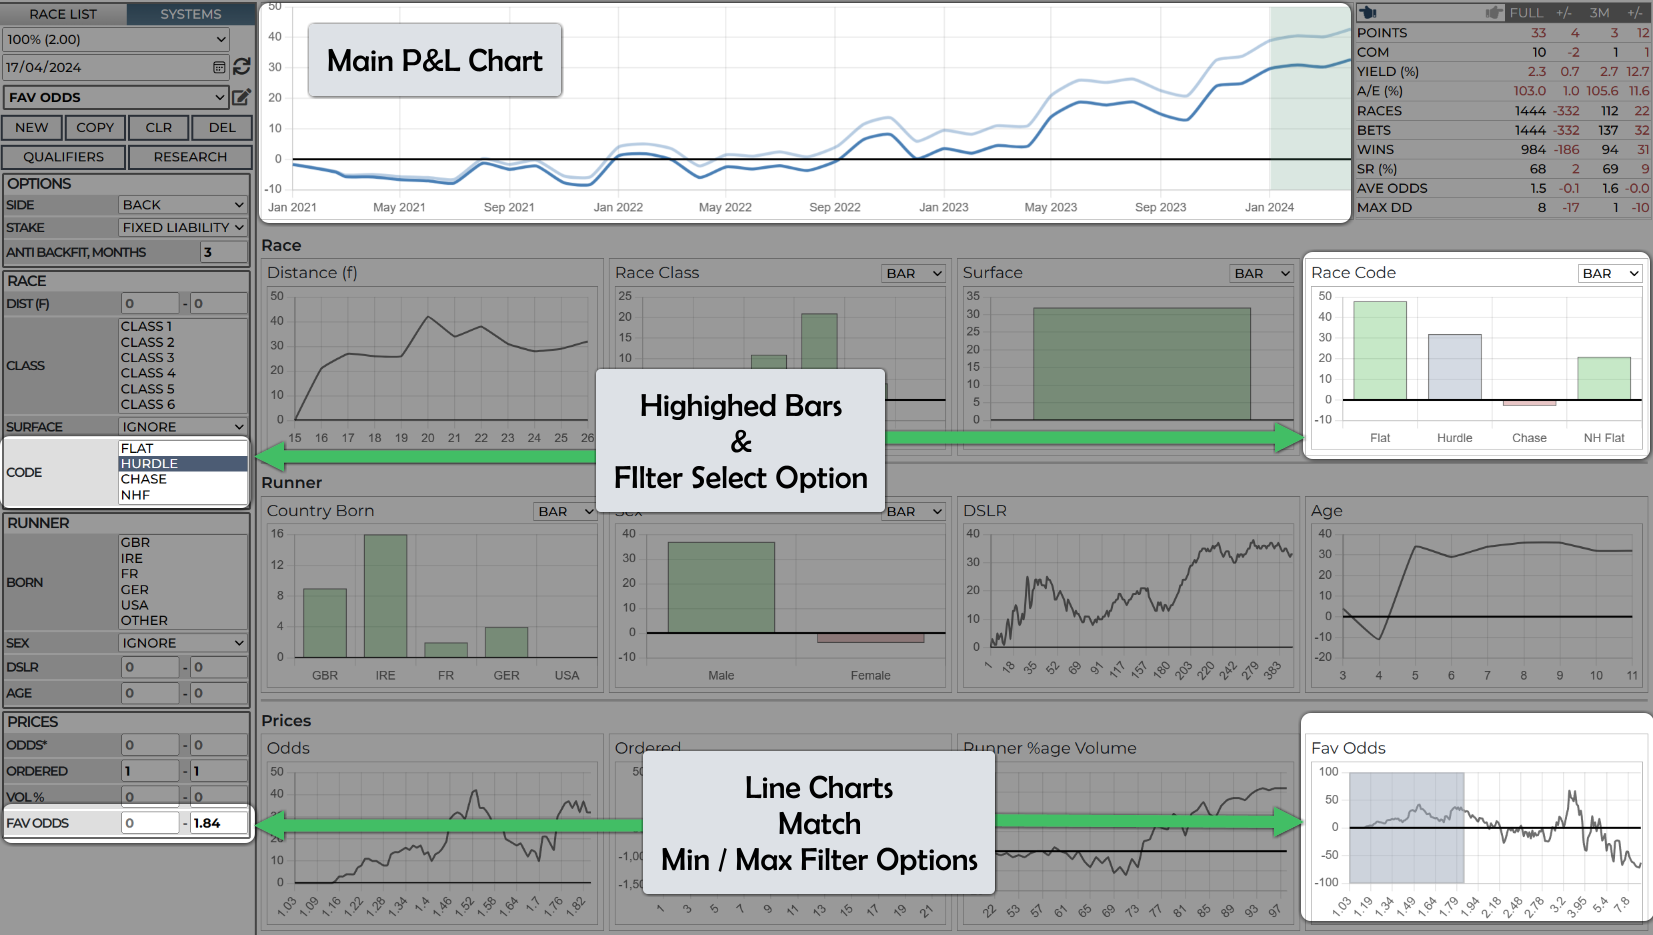
Our unique research system uses charts to show you the profitability of the elements of races and runners. These can be: bar charts, line charts or tables.
Its important to note two things about the charts data:
The profits are shown without commission applied - that's because its impossible and impractical to do so.
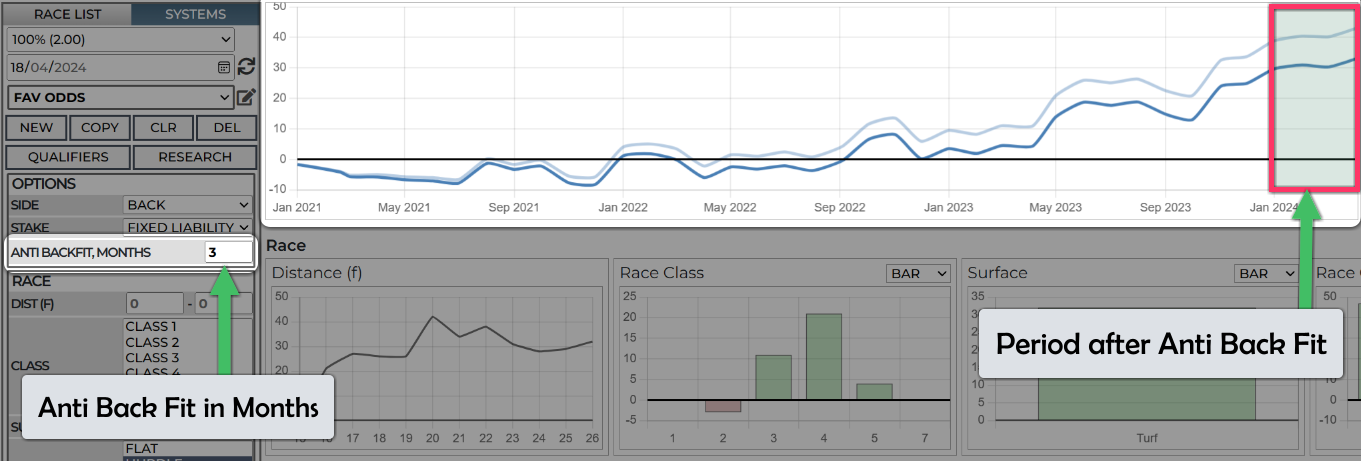
The profits are shown up to 3 months ago - this is to help prevent you back fitting systems. (the number of months is variable in the filter options, 3 is the default)
The main P&L shown is bang up to date and does include commission - we'll get to that later...
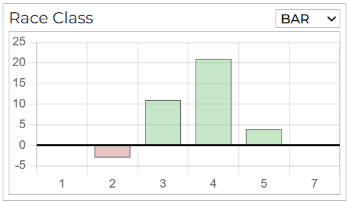
Bar charts show profit, in points, per category.
The Race Class chart here shows class 4 with most points.
Click the bar to select / deselect the categoy
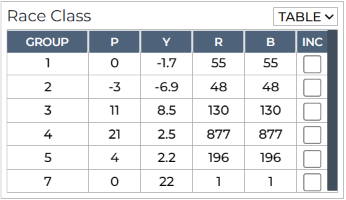
Tables show data in columns and have extra information, including: Yield (RIO), Runs and number of Bets (runners) in each category. Class 4 has most points, class 3 has the best Yield.
Click the 'inc' checkbox to select / deselect the category
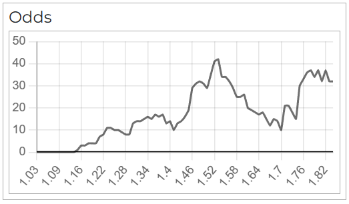
Line charts are shown when there are many categories, such as odds, and there they flow numerically. In this case, we're looking for 'up trends' in data.
The Odds chart shows a profits region from around 0 to 1.5.
Click on the chart and drag an area. Move the left or right side by dragging, move the whole area by dragging the middle:
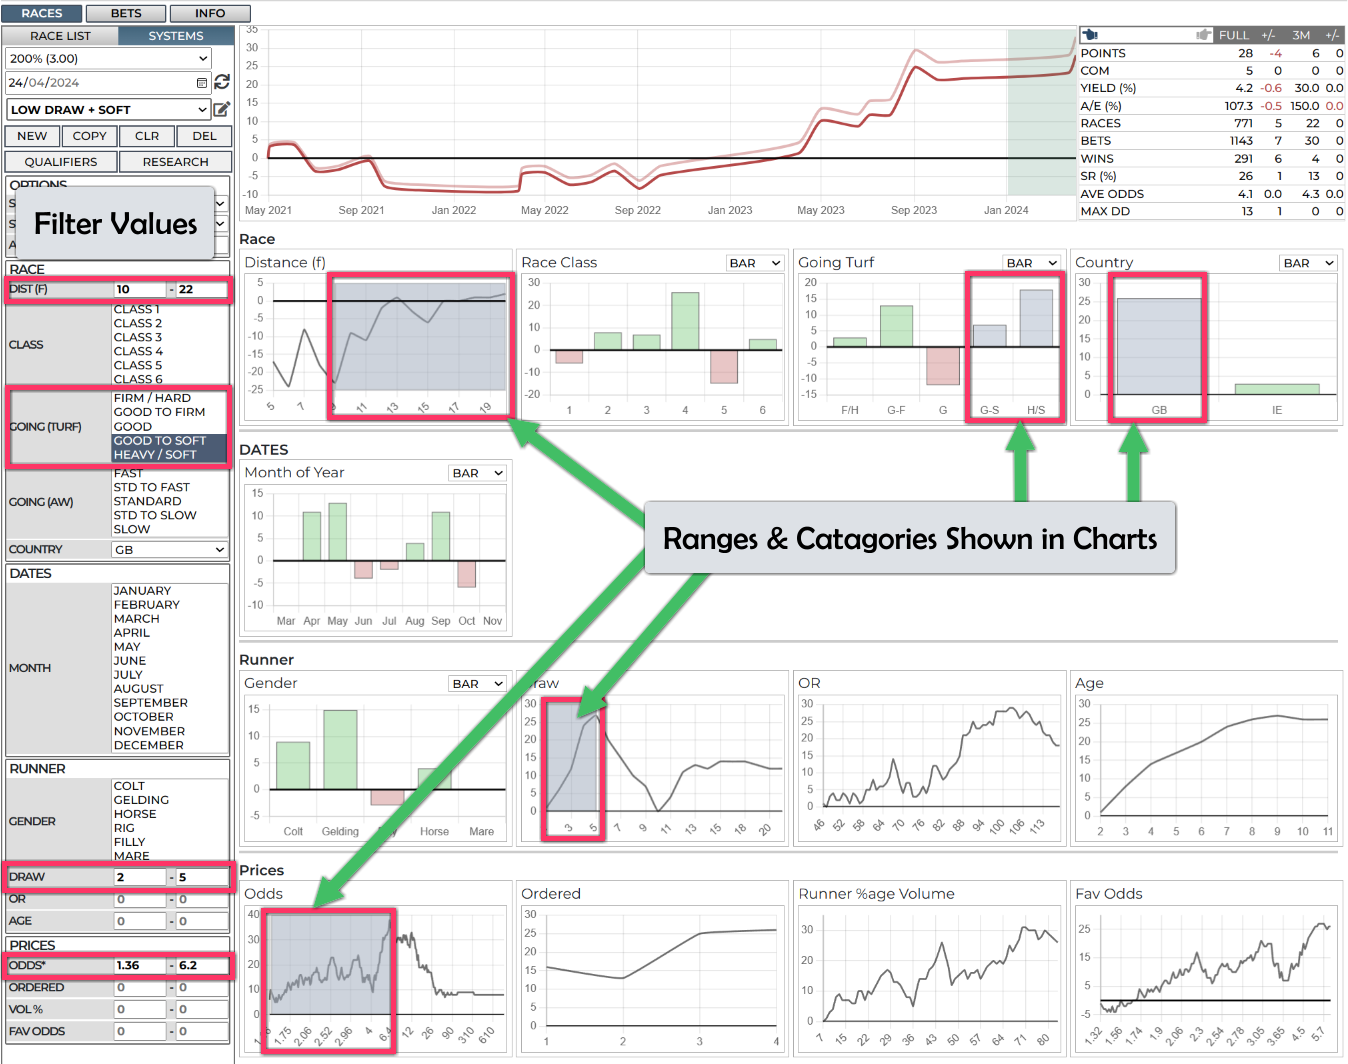
Filters are shown on the left, the values match the selected areas and categories in the charts and tables, with main P&L and stats at the top:
This method of data analysis can seem at touch overwhelming at first, stick with it and you'll quickly realise how much faster it is to build portfolios of systems.
Main P&L Chart & Anti Back Fit Feature
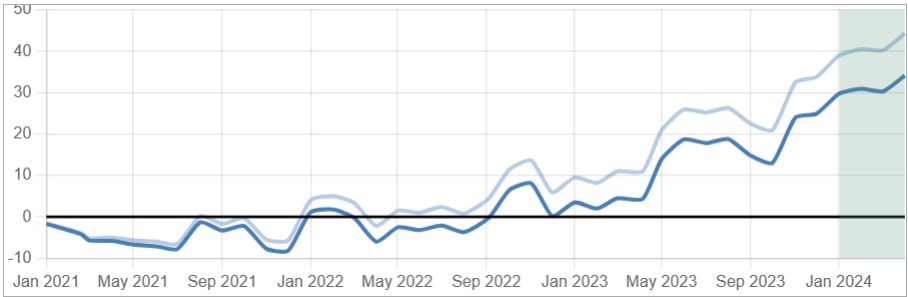
The main P&L chart shows 2 lines: with and without commission (at 2%) applied. The section at the end, highlighted in green, is the period after the selected 'anti back fit' period. You should make sure your systems are profitable in this period of time, if not then you've probably 'back fitted' the stats to fit and are likely circumstantial.
The filter charts show data 'up to' this time and thus its like you having carried out this research 3 months ago, then what happened afterwards (in the green section). This makes it much harder to pick circumstantial sets of filters.
System Stats & Navigation
Stats are shown for the full period and for just the selected 'anti back fit' period. Each has a +/- showing the change from your last search.
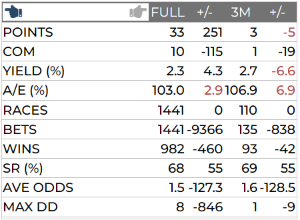
POINTS - Profit in points for last search.
COM - The amount of commission paid at 2%.
YIELD - The ROI of the system. Lay system yield is calculated as: profit, in points, divided by the full liability. This is done race by race to account for commission.
A/E - Actual v's Expected - over 100% is good. Calculated based on total bets expected to win, based on starting odds, against actual bets won.
RACES - The total number of races where bets were placed.
BETS - Total number of runners with bets.
SR - Strike rate as a percentage.
AVE ODDS - The average odds of bets in the system.
MAX DD - The biggest drawdown experienced. How far below the previous maximum did the system see before a recovery.
Navigate over previous search settings:
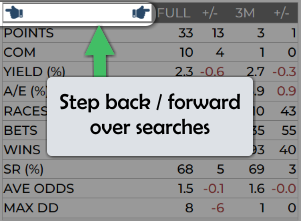
Quickly go back and forth over previous searches if you've forgotten what you did or want to compare. Systems are stored locally so navigation is very fast.
Filters
Setting filters returns bets that match the ranges and categories you choose.
There are three types of filter:
Ranges - A MIN and MAX value. A zero means the filter is not set.
Single Select - Choose ONE value from a select dropdown.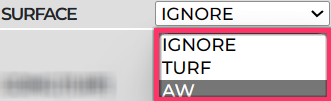
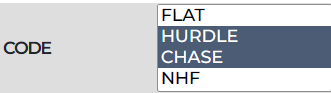
Multi Select - Choose one of more values from a list.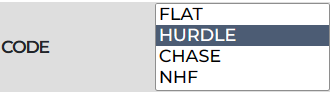
The main P&L shows profit for runners matching all filters
The filters charts are also filtered (but not against themselves - so we see the whole chart range).
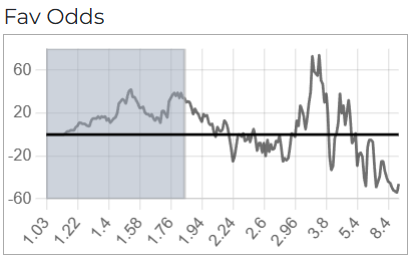
We have a range set against 'Fav Odds'. So, the we can see the area filter in blue, but the whole chart is shown as we don't apply the 'Fav Odds' filter to itsself.
Creating & Managing Systems
It is useful to start with some sort of premise, or idea, such as: low draw + slow ground, or low priced favourites with jockeys with a history of high percentage rivals beaten. You can then adjust the ranges of these criteria and perhaps add more filters to be more selective.
Its it advised to be quite broad with your filters, or keep the number of filtered metrics low. Very specific sets of a lot of filters may have worked in the past, but these precise ranges will not fit future results. Broad ranges (or few narrow ones) are more likely to.
In this example, I did the following:
Created a new system.
Selected a handful of filters I thought maybe relevant.
Selected Draw 1-3 and Going: Soft/Heavy.
Added Good to Soft (to increase the number of bets).
Increased draw to 2-5. (1-5 is also valid but it must be over 0 as this takes out runners with no draw stall!)
Adding a min distance to take short straight races out the equation.
Made it GB specific.
Added an odds range of 0-6.2.
Click LOCK & LOAD to save your system - you will lose it otherwise!
It should also be noted that more than once I needed to use the back / forward navigation to undo / redo changes. This is a very useful feature and one well worth being familiar with.
It took about 2 minutes to do - this serves as an EXAMPLE ONLY but shows how having all the filters you need as charts allows you to see where alterations can be applied very quickly and effortlessly.
Note that you do not need ranges applied to metrics to see the related charts.
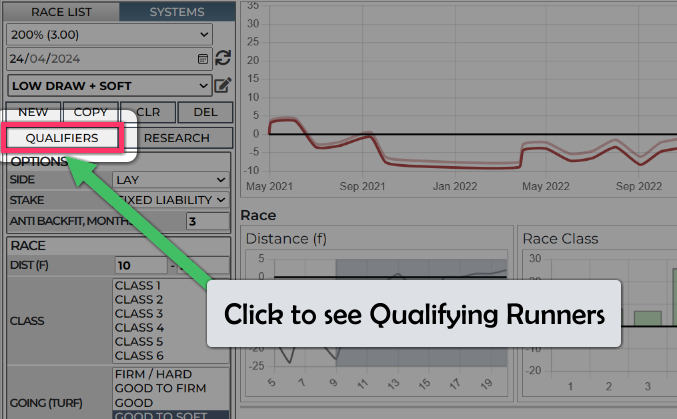
View Shortlisted Runners
At any time during your research, you can switch to see qualifying runners, for the date selected, as shown here:
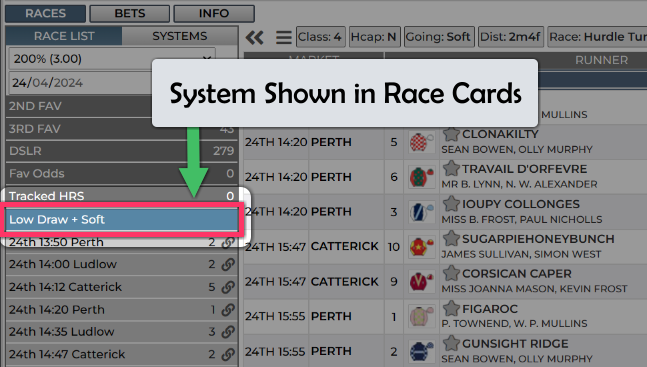
For general day to day viewing of your systems qualifiers, use the list of your systems on the race cards:
You can export, or view, a list of qualifiers via the 'Info Tab' to export to Excel or import into a third party automation betting solution
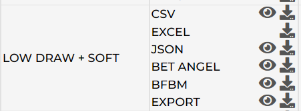
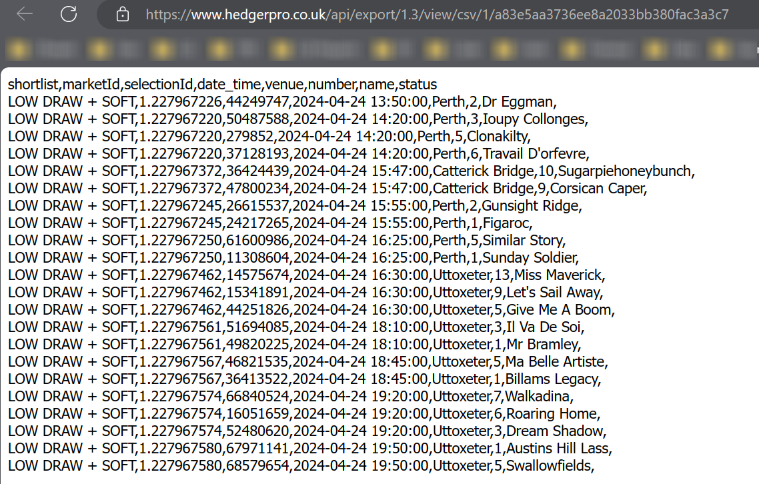
The 'eye' ion shows you the export in a web browser tab, the download symbol save a file to your PC / device. Here is an example of viewing a CSV. You may bookmark the URL if you wish to access it frequently, or use the URL in a third party automated software such as BFBM
Exporting to BFBM
BF Bot Manager is software for automated and manual trading and betting on the Betfair betting exchange. The software has been approved and certified by each betting exchange security team, which means that it has passed all exchange API requirements and is an official Betfair NGAPI solution.
To run the BF Bot Manager you must have a Windows operating system with Microsoft .Net Framework 4.7 (all newer systems have that), a reliable internet connection and at least 2GB of RAM memory.
For the software to work, your computer must be up and running all the time. It must not go into sleep mode, standby mode or hibernate. Your computer must also be connected to the internet at all times. Alternatively you can use a VPS - we recommend Windows VPS - Winity for this.
You can use the software to load any exchange market, place Back or Lay bets manually or create your own bot/strategy that will automatically place bets by your own rules. There is no limit on the number of strategies that you can create.
BF Bot Manager is developed and marketed by Sodens Ltd and can be downloaded at www.bfbotmanager.com.
Hedger Pro has been adapted to allow automated system / tip integration into BF Bot Manager. This section details how to; create the upload from Hedger to BF Bot Manager and to then set it up to place bets from your Hedger Pro system qualifiers.
1) Get the Hedger Pro System Link
On the INFO tab, click the 'eye' icon on the system you wish to export.
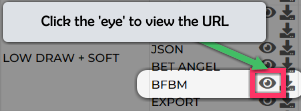
Your web browser will show load the days qualifiers under your unique system URL:
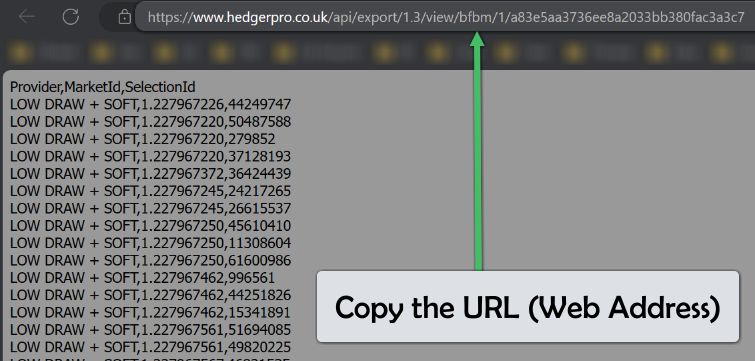
Check there are qualifiers (if you think there should be some today), then copy the URL from the address bar.
In BGBM, click 'Mange Tips'
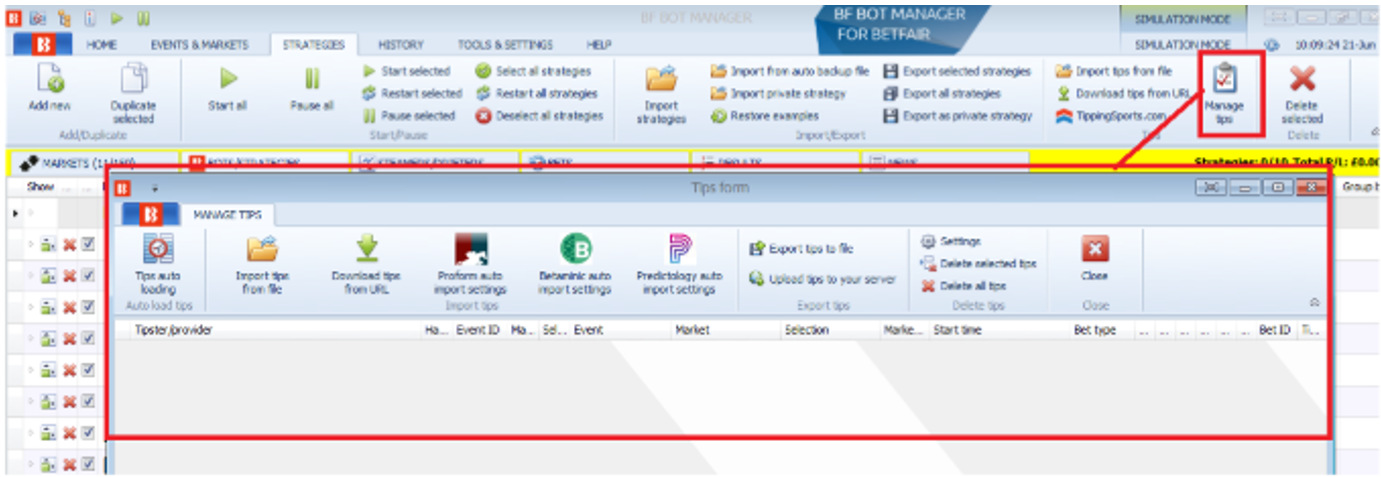
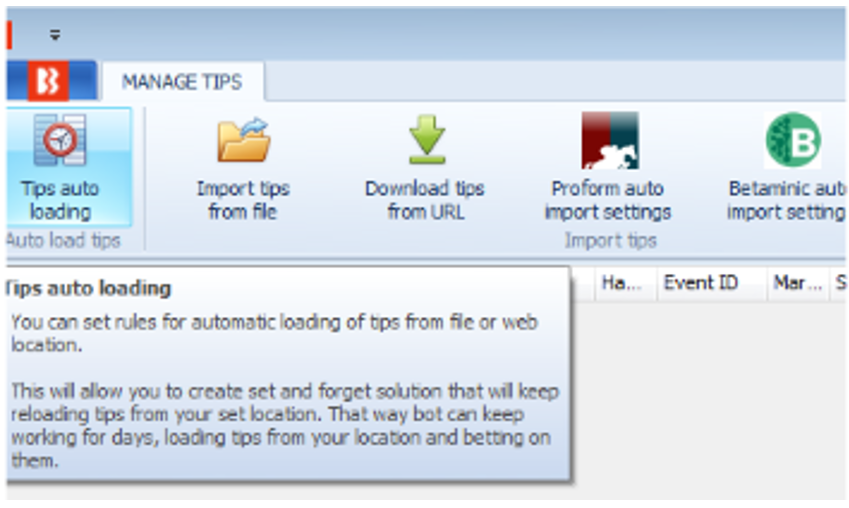
Then, click 'Tips auto Loading' in the 'Tips Window':
On this dialogue box you will add in the URL copied from Hedger Pro. The example below shows how the hedger system: “1) BFBOT example” was
incorporated, the same process would be used for “all shortlists” if you choose to export 'All Shortlists' from Hedger Pro

Please ensure that you tick the active box – if you don’t tick it your tips wont load, also please ensure that tips from Hedger Pro are loaded in once per day (or no more than once per hour) to ensure there is not excessive load placed on the Hedger Pro servers. If your systems are refreshing too fast they will be throttled by our export systems.
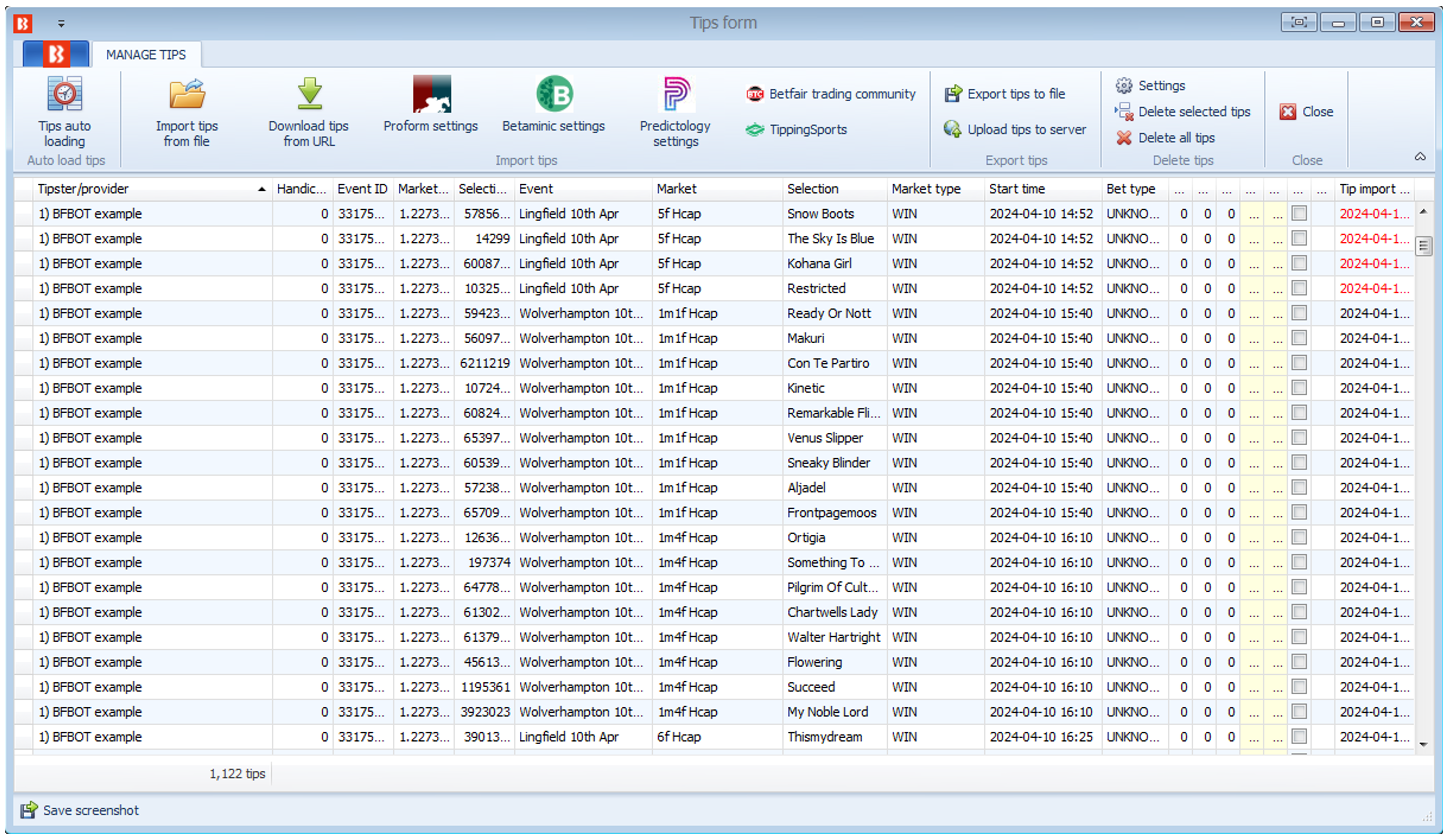
The screenshot shows an example of tips being loaded successfully
You should exclude any metrics that might change during the day from Hedger Pro system and let BFBM handle to filtering for these, these include:
Odds, Fav Odds, Ordered (Odds Rank), Number of Runners (if you're concerned about this changing due to withdrawals) and going.